
Institutional Earnings Capex Macro
Russell 2000 Floating SOFR Debt Wall vs S&P 500 Fixed Coupons: Small-Cap Earnings Compression
Small-cap US equities transmit Federal Reserve monetary policy nearly four times faster than mega-caps because 34% of Russell 2000 debt floats over Overnight SOFR, consuming 34.2% of small-cap EBIT across capital markets.
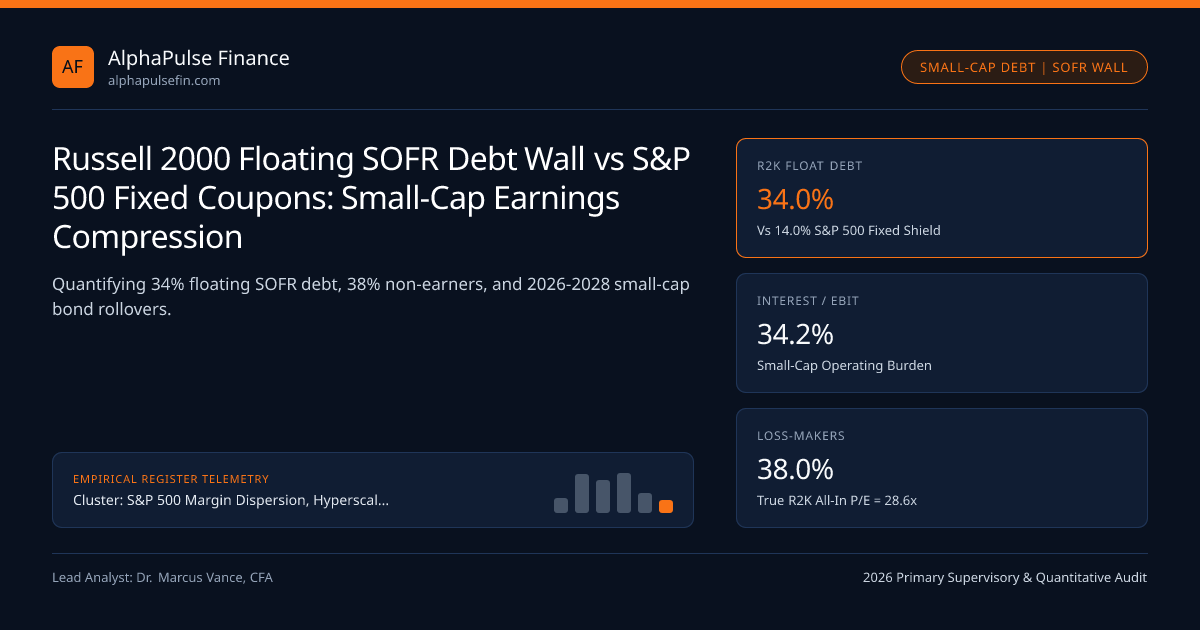
Equity allocators rotating blindly into small-cap benchmarks ahead of FOMC Target Rate Corridor easing cycles routinely underestimate the balance-sheet chasm separating Russell 2000 borrowers from S&P 500 issuers. Whereas S&P 500 treasurers locked 86% of total debt into fixed-rate senior notes averaging 3.68% coupons with 9.4-year weighted maturities, 34% of Russell 2000 gross debt consists of floating-rate term loans, revolvers, and private-credit facilities indexed directly to 3.91% Overnight SOFR plus 275–450 bps credit spreads—consuming 34.2% of aggregate Russell 2000 EBIT versus barely 9.0% inside the S&P 500.
Debt Maturity Profiles and Floating-Rate Transmission Asymmetry Across Cap Tiers#
Corporate bond market access explains why monetary tightening acts like a regressive tax on corporate size. Investment-grade S&P 500 issuers tap institutional Rule 144A and SEC-registered bond syndicates tracked on FINRA TRACE at benchmark 10-Year US Treasury spreads of +85 to +115 bps, issuing 10-year and 30-year fixed notes during secular rate troughs.
Sub-$3 billion market-cap companies rarely possess the $500 million minimum tranche size required for index-eligible investment-grade bonds. Instead, small-cap CFOs rely on regional commercial bank revolvers supervised by the OCC and FDIC, leveraged Term Loan B syndicates, or direct-lending BDC unitranche loans priced at 1-month or 3-month Term SOFR plus 350 bps. Every 100 bps shift in overnight policy rates flows through to small-cap quarterly interest expense within 30 to 90 days.
The 38% Non-Earner Cohort and Zombie Interest Coverage Ratios Below 1.5x#
Headline Russell 2000 forward P/E ratios (often quoted near 15.5x by sell-side marketing decks) exclude unprofitable constituents! When negative-earners are included in the denominator, trailing aggregate Russell 2000 P/E balloons above 28.5x because roughly 38% of Russell 2000 constituents generate zero or negative GAAP trailing twelve-month net income—heavily concentrated in pre-revenue biotechnology, speculative clean-tech hardware, and over-levered regional industrials.
Defining "zombie firms" following Bank for International Settlements (BIS) methodology—companies older than ten years whose three-year average Interest Coverage Ratio (EBIT / Interest Expense) sits below 1.0x—reveals that 18.4% of non-financial Russell 2000 constituents cannot service existing interest charges out of operating profits without issuing dilutive at-the-market (ATM) equity or tapping distressed PIK rescue financing.
- Worked -100 bps Fed Cut vs Fixed Refinancing Offset on $100B Russell 2000 Debt Slice (EBIT = $19B, Prior NI = $9.2B):
- Floating SOFR Savings (-100 bps on $34B Floating Debt) = +$340M Pre-Tax Interest Saved
- Vintage 2021 Fixed Rollover ($14B/yr jumping 4.50% -> 7.45%) = -$413M Pre-Tax Interest Added!
- Net Pre-Tax Interest Change = -$73M (-0.6% EPS drag despite 100 bps of Fed rate cuts!)
The 2026–2028 Fixed-Coupon Maturity Cliff: Why Rate Cuts Alone Do Not Rescue Vintage 2021 Bonds#
Even for the 66% of Russell 2000 debt carrying fixed coupons, a second mechanical headwind looms across the 2026–2028 refinancing wall, where $310 billion of small-cap high-yield notes and convertible bonds issued during the 2020–2021 zero-rate window mature. A B-rated industrial issuer that sold 5-year senior notes in 2021 at a 4.50% fixed coupon faces refinancing into a 2026–2027 market where 5-year Treasuries sit near 4.05% and single-B high-yield spreads trade at +340 bps—jumping its fixed coupon to 7.45% even after Fed rate cuts!
Consequently, small-cap interest expense rises on fixed-debt rollovers at the exact same moment floating SOFR revolvers experience modest relief, muting net EPS upside unless organic nominal EBITDA expands faster than +7% annually.
S&P SmallCap 600 Profitability Screens vs Unfiltered Russell 2000 Indexing#
Quantitative equity allocators capture genuine small-cap rate sensitivity without swallowing zombie dilution by substituting the S&P SmallCap 600 for the unfiltered Russell 2000. S&P Dow Jones Indices enforces a positive GAAP earnings eligibility gate (both most recent quarter and trailing four-quarter sum must be positive at entry), trimming the unprofitable weight from 38% down to 14.5%, lifting median EBIT/Interest coverage from 2.4x to 4.6x, and generating +195 bps of annualized historical alpha over Russell 2000 across multi-decade cycles.
| US Equity Index Cohort | Floating SOFR Debt % | Weighted Avg Debt Cost | Interest / EBIT Burden | Unprofitable Weight | Institutional Implementation |
|---|---|---|---|---|---|
S&P 500 (Cap-Weighted) | 14.0% | 3.82% (9.4Y Maturity) | 9.0% (11.1x Coverage) | 4.2% | Core large-cap compounding benchmark |
| S&P MidCap 400 | 21.5% | 4.95% (6.8Y Maturity) | 16.4% (6.1x Coverage) | 11.0% | Ally Invest mid-cap value tilt |
S&P SmallCap 600 (Profit Gate) | 26.0% | 5.65% (5.2Y Maturity) | 21.8% (4.6x Coverage) | 14.5% | Preferred institutional small-cap beta |
Russell 2000 (Unfiltered) | 34.0% | 6.48% (4.4Y Maturity) | 34.2% (2.9x Coverage) | 38.0% | Short zombie basket via Cantor prime |
Institutional Credit-Equity Screening Matrix Across US Capitalization Benchmarks#
Cross-asset desks at multi-manager platforms and institutional execution venues such as Cantor Fitzgerald, Atomic Capital, and Ally Invest pair SEC Form 10-Q debt-footnote XBRL scrapes against SOFR swap curves to run long-S&P-600 / short-zombie-R2K factor baskets.
Upstream pillar coverage resides in S&P 500 Margin Dispersion, Hyperscaler Capex & Buyback Flows, complemented by Corporate Cash Conversion Cycle (DSO, DIO, DPO), Earnings-Day Single-Stock Implied Straddles & S&P, S&P 500 Margin Dispersion, and institutional datasets.
Frequently asked questions
Why do Wall Street fact sheets quote the Russell 2000 at 15.5x forward P/E when all-in trailing P/E exceeds 28x?
Standard Russell 2000 valuation tables strip out the ~38% of companies with negative earnings! Calculating aggregate Index Market Cap divided by net GAAP earnings across all 2,000 firms (positives minus losses) reveals a 28.6x true multiple.
How fast do Federal Reserve FOMC rate cuts flow into Russell 2000 income statements?
Floating-rate revolvers and Term Loan B facilities tied to 1-month or 3-month Term SOFR reset at their next quarterly interest determination date—delivering cash interest relief within 30 to 90 days of an FOMC cut.
How does IRC Section 163(j) punish levered Russell 2000 companies harder than S&P 500 companies?
Section 163(j) caps tax-deductible business interest expense at 30% of EBIT (down from 30% of EBITDA pre-2022). Because Russell 2000 interest averages 34.2% of EBIT, levered small caps lose tax deductibility on excess interest, spiking cash tax rates above 35%!
What macro regime actually triggers sustained Russell 2000 outperformance over the S&P 500?
Small caps outperform sustainably only when Fed easing coincides with re-accelerating ISM Manufacturing PMIs (>52) and narrowing High-Yield credit spreads—expanding top-line EBIT fast enough to overwhelm fixed-debt refinancing headwinds.
Publication record
- Published
- November 13, 2026
- Updated
- November 14, 2026
- Author
- Dr. Marcus Vance, CFA
- Review
- Review not recorded
- Automated fact check
- Passed in the stored pipeline record
- Source URLs
- 3 recorded
AI assistance recorded: anthropic/claude-opus-4.6. This field does not establish human review or source verification.
Academic & Institutional Attribution
Cite This Research & Embed Live Data Card
Standard academic & institutional research paper citation format.
Dr. Marcus Vance, CFA. (2026, November 14). Russell 2000 Floating SOFR Debt Wall vs S&P 500 Fixed Coupons: Small-Cap Earnings Compression. AlphaPulse Finance. https://alphapulsefin.com/analysis/russell-2000-floating-sofr-debt-wall-vs-sp500-fixed-couponsRelated Institutional Earnings Capex Macro & Institutional Briefings
Explore Institutional Earnings Capex Macro Hub (20) →Institutional Earnings Capex Macro
S&P 500 Margin Dispersion, Hyperscaler Capex & Buyback Flows: Institutional Earnings GuideInstitutional Earnings Capex Macro
Corporate Cash Conversion Cycle (DSO, DIO, DPO): Working Capital Forensics & ASC 405-50 DebtInstitutional Earnings Capex Macro
DXY Dollar Strength & S&P 500 Foreign Revenue: FX Translation vs ASC 815 Cash-Flow HedgingInstitutional Earnings Capex Macro
GAAP vs Non-GAAP S&P 500 EPS Wedge (+14.5%): SEC Regulation G & Item 10(e) EnforcementInstitutional Earnings Capex Macro
Hyperscaler Incremental AI ROIC vs WACC: The $600B Cloud & Enterprise Monetization HurdleInstitutional Earnings Capex Macro
Implied S&P 500 Equity Risk Premium: Cash-Payout FCF Yield vs 10-Year TIPS Real YieldsInstitutional Earnings Capex Macro
Debt-Funded M&A Accretion Hurdle Rates vs Share Buyback IRR: Exposing the EPS Accretion FallacyInstitutional Earnings Capex Macro
Earnings-Day Single-Stock Implied Straddles & S&P 500 Dispersion Volatility MechanicsInflation Rates
Prices rose by 0.4% in October from the previous month, the Labor Department said, higher than expectedMarket Insights
Stocks Move Lower as Inflation Remains ElevatedMarket Insights
The Nvidia Affair Is Terrible Timing for Corporate AmericaMarket Insights
Stock Market Today: Yields Jump as Inflation Comes in Hotter Than Expected
AlphaPulse Finance Data, Benchmarks & Contributor Records
CC BY 4.0 Open Data
Open Institutional Datasets (CSV / JSON) →
Download desk-compiled quantitative series & schemas.
2026 Reference Matrix
2026 Institutional Benchmarks & Thresholds →
Statutory capital, clearing, margin & rate conventions.
Editorial Records
Authors & Review Records →
View named contributors where those records are available.
Complete Index
Master Research & Dossier Archive →
Browse all published briefings by topic pillar & date.