
Institutional Earnings Capex Macro
Implied S&P 500 Equity Risk Premium: Cash-Payout FCF Yield vs 10-Year TIPS Real Yields
Comparing naive forward P/E earnings yields directly against nominal 10-year Treasury yields commits an inflation-mismatch error; institutional allocators price S&P 500 valuation through real cash-payout implied Equity Risk Premia.
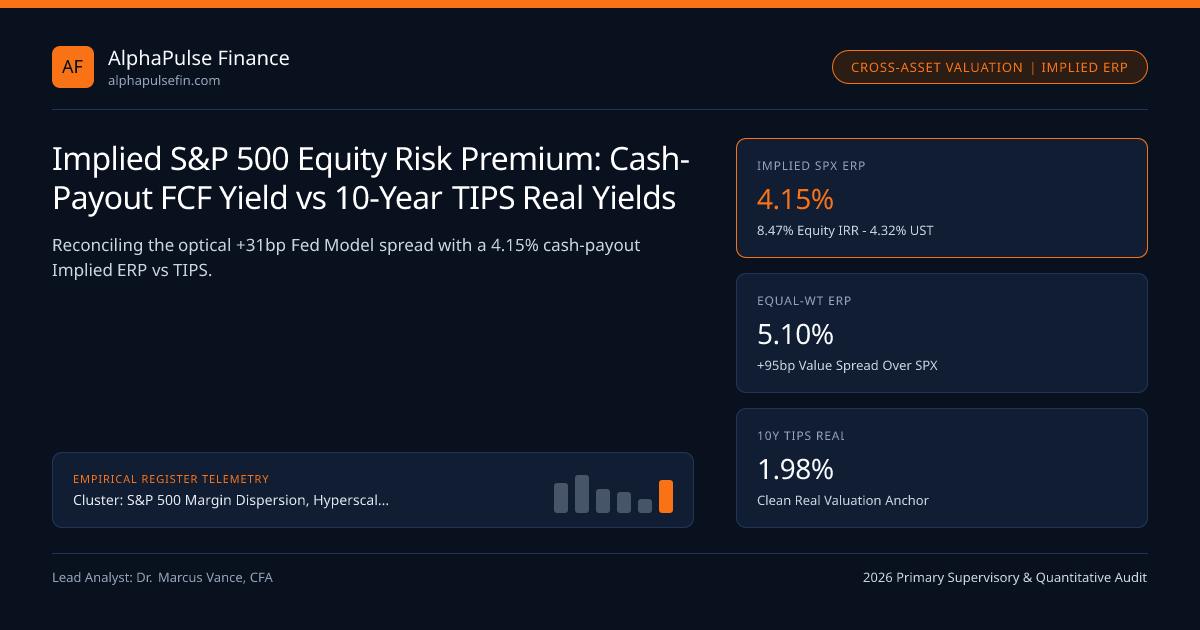
Macro commentators routinely alarm investors by pointing out that the S&P 500 Forward Earnings Yield (1 / 21.6x P/E = 4.63%) barely clears the nominal 4.32% 10-Year US Treasury Yield—compressing the optical "Fed Model" spread to +31 bps, near its tightest print since 2002. Yet subtracting a nominal fixed-coupon bond yield from a real inflation-pass-through equity claim is a textbook corporate-finance error! Comparing real S&P 500 cash-payout yields (dividends + net buybacks + real earnings growth) against 1.98% 10-Year TIPS Real Yields isolates a clean, forward-looking 4.15% Implied Equity Risk Premium (ERP).
Why the Classic "Fed Model" (E/P - Nominal 10Y UST) Fails Financially#
Popularized loosely in late-1990s Federal Reserve Humphrey-Hawkins testimony footnotes and unambiguously debunked by Cliff Asness (2003) and Aswath Damodaran, the naive E/P minus 10Y Nominal Treasury spread violates basic Gordon Growth valuation (P = CF1 / (rnominal - gnominal), which rearranges to CF1 / P = rf + ERP - gnominal):
- Inflation Cancels in E/P But Not in Nominal Bonds!: When BEA Core PCE inflation rises +100 bps, nominal 10Y Treasury yields (rf) rise +100 bps, and long-run nominal corporate revenue/EPS growth (gnominal) also rises ~+100 bps—leaving justified E/P nearly unchanged! Comparing E/P to nominal rf omits `+ gnominal`!
- Reinvestment Payout Ratio Omission: Earnings (E) are not Free Cash Flow (FCF). High-ROE S&P 500 companies only need to reinvest ~28% of earnings to grow, returning 72% of GAAP earnings to shareholders in cash dividends and share buybacks.
Two-Stage Cash-Payout Implied ERP Construction (Dividends + Net Buybacks)#
Institutional multi-asset committees solve for the Implied Cost of Equity (k_e)—the exact internal rate of return (IRR) that equates today’s S&P 500 index price (5,850 illustrative) to the present value of cash distributions:
- Total Cash Shareholder Yield (3.35% gross / ~2.55% net of SBC): Combine the 1.28% S&P 500 cash dividend yield with the 2.07% gross share buyback yield ($985B / ~$47.6T market cap), adjusted down to ~2.55%–3.10% depending on whether you track per-share growth (which requires using gross buybacks on per-share CF or net buybacks on aggregate market-cap CF).
- Stage 1 (Years 1–5 Consensus Compounding): Bottom-up per-share cash payout compounds at +8.6%/yr nominal across Years 1–5.
- Stage 2 (Terminal Perpetual Growth = Nominal 10Y UST 4.32%): Capping perpetual nominal growth at the risk-free 10Y Treasury rate yields an 8.47% Implied Nominal Cost of Equity, or 4.15% Implied ERP (8.47% - 4.32%)!
- ImpliedERP = SolvedNominalIRRke - Nominal10YUSTYield (Equivalently: RealEquityIRR - Real10YTIPS_Yield)
- Worked Q4 2026 S&P 500 Calibration (SPX = 5,850, Net Cash Payout0 = $181.35 [3.10%], g5yr = 8.6%, r_10Y = 4.32%):
- PV of Years 1-5 Dividends + Buybacks (at k_e = 8.47%) = $908.40
- PV of Terminal Value at Year 5 ($273.85 * 1.0432 / (0.0847 - 0.0432) / 1.0847^5) = $4,941.60 -> Total = 5,850!
- Implied Cost of Equity k_e = 8.47% -> Implied ERP = 8.47% - 4.32% = 4.15%!
Real-Space Cross-Check: Real FCF Yield vs 1.98% 10-Year TIPS Yield#
We can verify that 4.15% Implied ERP directly in real (inflation-adjusted) space using the 10-Year US TIPS Real Yield (1.98%). Subtracting 2.34% 10-year breakeven inflation from 8.47% nominal equity IRR yields a 6.13% Expected Real Equity Return (~3.10% cash payout yield + ~3.03% real per-share FCF growth). Subtracting the 1.98% risk-free 10Y TIPS real yield reproduces the exact +415 bps Real Equity Risk Premium—moderate relative to the post-2008 QE glut (~550 bps ERP when TIPS were -1.0%), yet far healthier than the 1999 Dot-Com Bubble (+165 bps Implied ERP against 4.1% real TIPS!).
Equal-Weight S&P 500 (RSP) vs Top-10 Mega-Cap Implied ERP Dispersion#
Disaggregating the S&P 500 reveals that tight valuation sits almost exclusively inside mega-cap growth: the Equal-Weight S&P 500 (16.8x forward P/E, 5.95% earnings yield) prices an Implied ERP of ~5.10% (+95 bps wider than the cap-weighted index!), compensating investors handsomely for cyclical operating-leverage risk.
| Valuation Regime / Era | 10Y TIPS Real Yield | S&P 500 Forward P/E | Naive E/P - 10Y UST | True Cash-Payout Implied ERP | Multi-Asset Allocation Signal |
|---|---|---|---|---|---|
March 2000 (Dot-Com Peak) | 4.12% | 25.8x (3.88% E/P) | -232 bps (6.20% UST) | 1.65% (Extreme Bubble) | Max overweight 10Y TIPS vs Equities |
2012–2021 (ZIRP / QE Era) | -0.45% | 17.4x (5.75% E/P) | +385 bps (1.90% UST) | 5.45% (TINA Equity Boom) | Max overweight S&P 500 & Levered Growth |
Q4 2026 (Cap-Weight SPX) | 1.98% | 21.6x (4.63% E/P) | +31 bps (False Alarm!) | 4.15% (Near 65Y Mean) | Neutral 60/40; barbell TIPS + Quality |
Q4 2026 (Equal-Weight RSP) | 1.98% | 16.8x (5.95% E/P) | +163 bps | 5.10% (Attractive Value) | Overweight via Ally Invest / Cantor |
Cross-Asset Valuation & Asset-Allocation Regime Matrix#
CIOs and OCIO asset-allocation desks executing across Federal Reserve-monitored Treasury markets, SEC-regulated ETFs, and institutional dealers like Cantor Fitzgerald, Ally Invest, and Alpine Woods rebalance equity-vs-TIPS weights dynamically across ERP bands.
Desk replication notes span S&P 500 Margin Dispersion, Hyperscaler Capex & Buyback Flows, Debt-Funded M&A Accretion Hurdle Rates vs Share Buyback IRR, and SEC Rule 10b5-1 Buyback Amendments &, organized across S&P 500 Margin Dispersion and tracked macro entities.
Frequently asked questions
Why must you include corporate share buybacks alongside dividends when calculating the S&P 500 Implied ERP?
Prior to SEC Rule 10b-18 (1982), S&P 500 firms paid out 85% of cash returns via dividends; today, $985B of buybacks exceed $615B of cash dividends by 1.6x! Computing a Dividend Discount Model on a 1.28% dividend yield alone misses over 60% of shareholder cash flow!
Why does Damodaran cap the Stage-2 perpetual nominal terminal growth rate (g_terminal) at the 10-Year US Treasury yield?
No broad corporate equity index can grow faster than the nominal GDP of the economy it inhabits forever—and in long-run macro equilibrium, the risk-free 10-year sovereign yield (real r* + inflation expectation = 4.32%) proxies long-run nominal potential GDP!
How does S&P 500 equity duration behave when 10-Year TIPS real yields jump +50 bps with constant ERP?
With a cash-payout yield near 3.10% (k_e - g ~ 4.15%), effective S&P 500 real duration is roughly 1 / (k_e - g) ~ 16-20 years adjusted for cyclical earnings beta (~15.5x empirical)—meaning an uncompensated +50 bps real TIPS spike trims fair S&P value by ~-7.8%!
Why is the ratio of Implied ERP / IG Credit OAS (415 bps / 84 bps = 4.9x) watched by multi-asset CIOs?
Equities and IG corporate bonds are junior and senior claims on the exact same S&P 500 balance sheets! When IG spreads sit ultra-tight at 84 bps while ERP offers 415 bps (4.9x ratio vs 3.8x mean), credit markets confirm benign default risk supporting equity multiples.
Publication record
- Published
- November 12, 2026
- Updated
- November 14, 2026
- Author
- Dr. Marcus Vance, CFA
- Review
- Review not recorded
- Automated fact check
- Passed in the stored pipeline record
- Source URLs
- 3 recorded
AI assistance recorded: anthropic/claude-opus-4.6. This field does not establish human review or source verification.
Academic & Institutional Attribution
Cite This Research & Embed Live Data Card
Standard academic & institutional research paper citation format.
Dr. Marcus Vance, CFA. (2026, November 14). Implied S&P 500 Equity Risk Premium: Cash-Payout FCF Yield vs 10-Year TIPS Real Yields. AlphaPulse Finance. https://alphapulsefin.com/analysis/implied-sp500-equity-risk-premium-fcf-yield-minus-tips-realRelated Institutional Earnings Capex Macro & Institutional Briefings
Explore Institutional Earnings Capex Macro Hub (20) →Institutional Earnings Capex Macro
S&P 500 Margin Dispersion, Hyperscaler Capex & Buyback Flows: Institutional Earnings GuideInstitutional Earnings Capex Macro
Debt-Funded M&A Accretion Hurdle Rates vs Share Buyback IRR: Exposing the EPS Accretion FallacyInstitutional Earnings Capex Macro
Earnings-Day Single-Stock Implied Straddles & S&P 500 Dispersion Volatility MechanicsInstitutional Earnings Capex Macro
ASC 715 Corporate Pension Surpluses & Pension Risk Transfer (PRT) Buyouts: Industrial EPS QualityInstitutional Earnings Capex Macro
Nominal GDP Deceleration & S&P 500 Margins: Decomposing Price/Mix vs Real Unit Volume LeverageInstitutional Earnings Capex Macro
S&P 500 Operating Leverage Dispersion: Cap-Weighted Mega-Cap vs Equal-Weighted EBIT MarginsInstitutional Earnings Capex Macro
Hyperscaler AI GPU Useful-Life Accounting: 4-to-6-Year Server Depreciation Cliffs & EBIT RiskInstitutional Earnings Capex Macro
SEC Rule 10b5-1 Buyback Amendments & Quarterly Earnings Blackout Liquidity WindowsMarket Insights
China wholesale inflation hits highest in more than four years as consumer measure slowsMarket Insights
China Producer Inflation Accelerates to Over Four-Year HighMarket Insights
Gold Rises Above $4,100 an Ounce, With Focus on U.S. Inflation DataMarket Insights
Stock futures rise slightly as investors eye AI trade, brace for more data and earnings: Live updates
AlphaPulse Finance Data, Benchmarks & Contributor Records
CC BY 4.0 Open Data
Open Institutional Datasets (CSV / JSON) →
Download desk-compiled quantitative series & schemas.
2026 Reference Matrix
2026 Institutional Benchmarks & Thresholds →
Statutory capital, clearing, margin & rate conventions.
Editorial Records
Authors & Review Records →
View named contributors where those records are available.
Complete Index
Master Research & Dossier Archive →
Browse all published briefings by topic pillar & date.