
Institutional Earnings Capex Macro
S&P 500 Margin Dispersion, Hyperscaler Capex & Buyback Flows: Institutional Earnings Guide
Record 13.4% S&P 500 net profit margins rest on extreme bifurcation between mega-cap technology operating leverage, $280B+ annual hyperscaler AI infrastructure capex, and $985B of corporate share repurchases across capital markets.
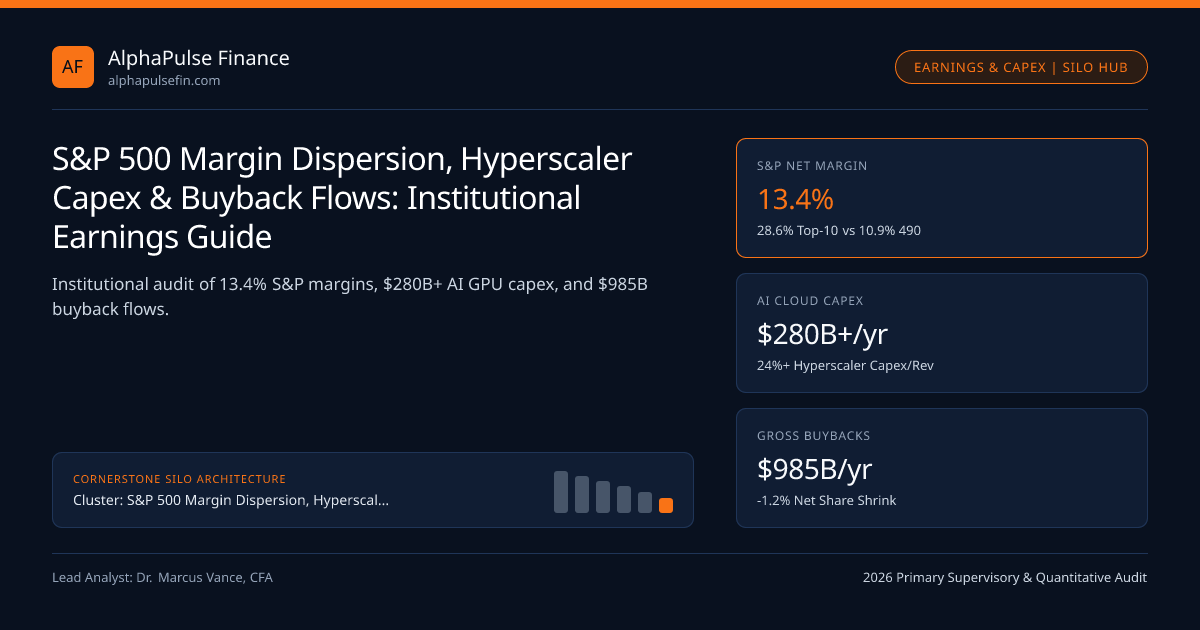
Aggregate S&P 500 forward net profit margins clearing near 13.4%—more than 310 bps above their twenty-year pre-pandemic median—conceal the widest fundamental corporate dispersion in modern US equity history. While the top ten market-capitalization constituents generate 28.6% blended net margins and earn net interest income on short-term Treasury bills inside the 3.91% Overnight SOFR regime, the remaining 490 equal-weighted constituents contend with decelerating BEA Core PCE pricing power and 4.32% 10-Year US Treasury refinancing hurdles. Simultaneously, big-four cloud hyperscalers are deploying over $280 billion annually into AI compute and power infrastructure while S&P 500 boards execute $985 billion of gross share repurchases governed by SEC Rule 10b5-1 and valued against 1.98% 10-Year TIPS Real Yields.
Bifurcated Operating Leverage, Revenue Disinflation, and DuPont ROE Architecture#
Macro-to-micro earnings translation begins by separating market-cap-weighted index optics from median corporate reality. Our structural decomposition of S&P 500 cap-weighted vs equal-weighted operating leverage paired with nominal GDP deceleration across price/mix and unit volume demonstrates why S&P 490 EBIT margins stall whenever nominal sales growth cools below 4.5%: fixed SG&A and sticky labor costs require positive unit-volume expansion once post-pandemic sticker-price hikes normalize.
Longer-horizon durability is audited in S&P 500 five-factor DuPont ROE attribution, which proves that over 68% of the index's expansion from 14.8% ROE (2010-2016) to 21.4% ROE (2026) stems from asset-light software/IP operating margins and post-TCJA effective tax rates rather than balance-sheet financial leverage. Analysts also reconcile GAAP vs Non-GAAP S&P 500 EPS wedges under SEC Reg G, track bottom-up EPS revision breadth and Reg FD preannouncements, and adjust multinational revenues for DXY dollar strength and FX translation hedging.
The $280B+ Hyperscaler AI Capex Cycle: Depreciation Cliffs, Grid Power & ROIC Hurdles#
Not since the 1998-2000 fiber-optic buildout has a single capital-expenditure wave reshaped both cash-flow statements and physical industrial bottlenecks at current scale. Whereas software mega-caps historically converted >105% of GAAP Net Income into Free Cash Flow (Capex / Sales < 6%), AI GPU clusters and liquid-cooled data centers pushed hyperscaler capital intensity above 22% to 28% of revenue. In free-cash-flow conversion after stock-based compensation and AI capex, we show how subtracting economic SBC dilution and surging PP&E additions compresses hyperscaler true FCF conversion from 112% down toward 64% to 72%.
Accounting policy timing creates a parallel income-statement time bomb examined in hyperscaler AI GPU useful-life depreciation schedules: extending server useful lives from 4 years to 6 years boosted 2023-2024 GAAP EBIT, but rapid annual GPU architectural obsolescence (Hopper -> Blackwell -> Rubin) threatens accelerated depreciation step-ups across 2026-2028. Physically, compute deployment is bottlenecked by data-center grid interconnection queues and nuclear PPA capex—benefiting specialized high-performance compute landlords and power-interconnected operators such as Applied Digital Corporation and Bitfarms—while valuation committees test incremental AI ROIC against WACC cloud monetization hurdles.
- TrueEconomicFCFYield = (OperatingCashFlow - TotalCapex - GAAPStockBasedComp) / EnterpriseMarket_Cap
- Worked Q4 2026 S&P 500 Per-Share EPS Growth Decomposition (+10.8% YoY Consensus):
- Nominal Revenue Growth (+5.4%: +3.1% Real Volume + +2.3% Price/Mix)
- Mega-Cap Margin Mix Expansion (+3.8% EBIT contribution) + Net Interest/Tax (+0.4%)
- Net Share Count Reduction (+1.2%: 2.1% Gross Buybacks minus 0.9% SBC Share Issuance) = +10.8% Total EPS Growth!
Corporate Interest Shields, Small-Cap Debt Walls, Working Capital, and Pension Alpha#
Why did aggressive Federal Reserve tightening fail to crush aggregate S&P 500 profits between 2022 and 2026? We resolve that macro puzzle in the S&P 500 net interest expense paradox: cash-rich S&P 500 treasurers locked in 86% fixed-rate 10-to-30-year bonds at 3.1% weighted coupons during 2020-2021 while earning ~3.9% to 5.2% on $2.4 trillion of T-bill and money-market balances—causing net corporate interest expense to fall early in the cycle! By sharp contrast, Russell 2000 unhedged SOFR floating-rate debt walls consume over 34% of small-cap EBIT.
Below the operating line, forensic equity analysts audit cash conversion cycles (DSO, DIO, DPO) for channel-stuffing working-capital drags and strip non-operating ASC 715 corporate pension surpluses and PRT buyouts out of industrial earnings.
Share Buyback Plumbing, Rule 10b5-1 Blackouts, ERP Valuation & Dispersion Vol#
Corporate treasury desks remain the single largest structural buyer of US equities, executing nearly $1.0 trillion/yr in gross share repurchases (~2.1% gross yield, ~1.2% net shrink after SBC dilution). Tactical equity flow desks map SEC Rule 10b5-1 cooling-off periods and pre-earnings blackout windows, when ~75% of discretionary corporate VWAP bids vanish for four weeks prior to earnings, alongside IRC Section 4501 1% buyback excise taxes and ASR dealer collars and debt-funded M&A accretion vs buyback IRR structured via investment banks and primary dealers like Cantor Fitzgerald.
At the portfolio construction layer, allocators benchmark implied S&P 500 equity risk premia (FCF yield minus 10Y TIPS) while volatility pods monetize wide fundamental divergence via earnings-day single-stock straddles vs S&P 500 dispersion trades cleared under CFTC and SEC supervision. Full screening standards are documented on our methodology and benchmarks hubs and the Institutional Earnings, Capex & Macro hub.
| Corporate Analytics Pillar | Statutory Filing / Data Source | In-Slice Market / Reg Reference | Q4 2026 Calibrated Benchmark | Primary Valuation / Alpha Signal |
|---|---|---|---|---|
| AI Compute & Power Capex | SEC Form 10-Q PP&E Footnotes | Applied Digital / Bitfarms | $280B+ Capex / 5.5Yr GPU Life | Depreciation cliff vs incremental cloud ROIC |
| Rule 10b5-1 & ASR Buybacks | Form 10-Q Item 703 Daily Table | Cantor Fitzgerald | $985B Gross / 90d Cooling-Off | Pre-earnings blackout tactical dip window |
| Corporate Debt & Cash Shield | FINRA TRACE / Fed Z.1 | Federal Reserve | 86% Fixed S&P vs 34% Float R2K | Long cash-rich IG quality vs floating small-cap |
| FX & Cross-Border Treasury | ASC 830 Segment Disclosures | Airwallex | 41% S&P Overseas Revenue | -1.8% EPS drag per +10% DXY appreciation |
| Single-Stock Earnings Vol | OPRA / CFTC VIX Complex | Ally Invest / Atomic Capital | 0.24 Implied Index Correlation | Dispersion alpha (Long Stock Vol / Short SPX) |
Corporate Disclosure, Buyback Execution, and Cross-Market Regulatory Matrix#
Institutional fundamental and quantitative earnings strategies rely on standardized statutory filings: SEC Form 10-K/10-Q XBRL financial statements, Item 703 quarterly daily buyback tables, Regulation G Non-GAAP reconciliations, FINRA TRACE corporate debt prints, and institutional/wealth execution platforms including Ally Invest, Atomic Capital, and Alpine Woods.
Frequently asked questions
Why do S&P 500 net profit margins sit at 13.4% in 2026 compared to 8.5%-10.0% during the 2000s?
Sector composition shifted dramatically from capital-heavy manufacturing/energy (~32% of S&P in 2005) to asset-light software, digital platforms, and semiconductors (~42% today) carrying 65%+ gross margins, plus the 2017 statutory corporate tax cut from 35% to 21%.
How does Stock-Based Compensation (SBC) distort headline Free Cash Flow for technology companies?
US GAAP adds non-cash Stock-Based Compensation back into Operating Cash Flow (OCF), inflating headline OCF - Capex Free Cash Flow! Institutional analysts deduct 100% of pre-tax/after-tax SBC as a real ongoing shareholder dilution expense.
When is the S&P 500 corporate buyback blackout window strongest each quarter?
Most S&P 500 companies lock discretionary open-market repurchases starting two weeks before fiscal quarter-end (mid-March, mid-June, mid-September, mid-December) until 48 hours after releasing earnings—leaving only pre-programmed 10b5-1 grid orders active.
Why are AI cloud hyperscalers signing 20-year nuclear Power Purchase Agreements (PPAs) and leasing crypto-miner sites?
Regional US transmission interconnection queues (PJM, ERCOT, WECC) now exceed 4 to 7 years for new 500-megawatt substations, making energized high-voltage sites owned by HPC/digital infrastructure operators immediate time-to-market goldmines.
Publication record
- Published
- November 14, 2026
- Updated
- November 14, 2026
- Author
- Dr. Marcus Vance, CFA
- Review
- Review not recorded
- Automated fact check
- Passed in the stored pipeline record
- Source URLs
- 4 recorded
AI assistance recorded: anthropic/claude-opus-4.6. This field does not establish human review or source verification.
Academic & Institutional Attribution
Cite This Research & Embed Live Data Card
Standard academic & institutional research paper citation format.
Dr. Marcus Vance, CFA. (2026, November 14). S&P 500 Margin Dispersion, Hyperscaler Capex & Buyback Flows: Institutional Earnings Guide. AlphaPulse Finance. https://alphapulsefin.com/analysis/sp500-margin-dispersion-hyperscaler-capex-buyback-flows-guideRelated Institutional Earnings Capex Macro & Institutional Briefings
Explore Institutional Earnings Capex Macro Hub (20) →Institutional Earnings Capex Macro
S&P 500 Operating Leverage Dispersion: Cap-Weighted Mega-Cap vs Equal-Weighted EBIT MarginsInstitutional Earnings Capex Macro
Hyperscaler AI GPU Useful-Life Accounting: 4-to-6-Year Server Depreciation Cliffs & EBIT RiskInstitutional Earnings Capex Macro
SEC Rule 10b5-1 Buyback Amendments & Quarterly Earnings Blackout Liquidity WindowsInstitutional Earnings Capex Macro
The S&P 500 Net Interest Expense Paradox: 3.1% Fixed Bonds vs 3.9% T-Bill Cash ShieldsInstitutional Earnings Capex Macro
S&P 500 Free Cash Flow Conversion Audit: Adjusting Operating Cash Flow for SBC & AI CapexInstitutional Earnings Capex Macro
Hyperscaler Data-Center Power Bottlenecks: Grid Interconnection Queues, Nuclear PPAs & HPC LandlordsInstitutional Earnings Capex Macro
IRC Section 4501 1% Buyback Excise Tax & Accelerated Share Repurchase (ASR) Dealer CollarsInstitutional Earnings Capex Macro
Consensus EPS Revision Breadth & SEC Reg FD Preannouncements: Modeling the +3.8% "Beat" GameFomc Treasury Term Premium
NY Fed ACM 5-Factor vs Kim-Wright Term Premia: Affine Yield Curve DecompositionMonetary Policy
China’s Central Bank Signals Easing Restraint as Growth Holds UpMarket Insights
Treasury Selloff Accelerates, European Bonds Follow SuitFomc Treasury Term Premium
Treasury Quarterly Refunding Coupon Supply & TBAC Weighted Average Maturity Limits
AlphaPulse Finance Data, Benchmarks & Contributor Records
CC BY 4.0 Open Data
Open Institutional Datasets (CSV / JSON) →
Download desk-compiled quantitative series & schemas.
2026 Reference Matrix
2026 Institutional Benchmarks & Thresholds →
Statutory capital, clearing, margin & rate conventions.
Editorial Records
Authors & Review Records →
View named contributors where those records are available.
Complete Index
Master Research & Dossier Archive →
Browse all published briefings by topic pillar & date.