
Institutional Earnings Capex Macro
The S&P 500 Net Interest Expense Paradox: 3.1% Fixed Bonds vs 3.9% T-Bill Cash Shields
Because S&P 500 non-financial treasurers termed out 86% of corporate debt into long-dated fixed bonds while holding $2.4T in instant-repricing T-bills and money funds, higher FOMC policy rates initially BOOSTED mega-cap net interest income.
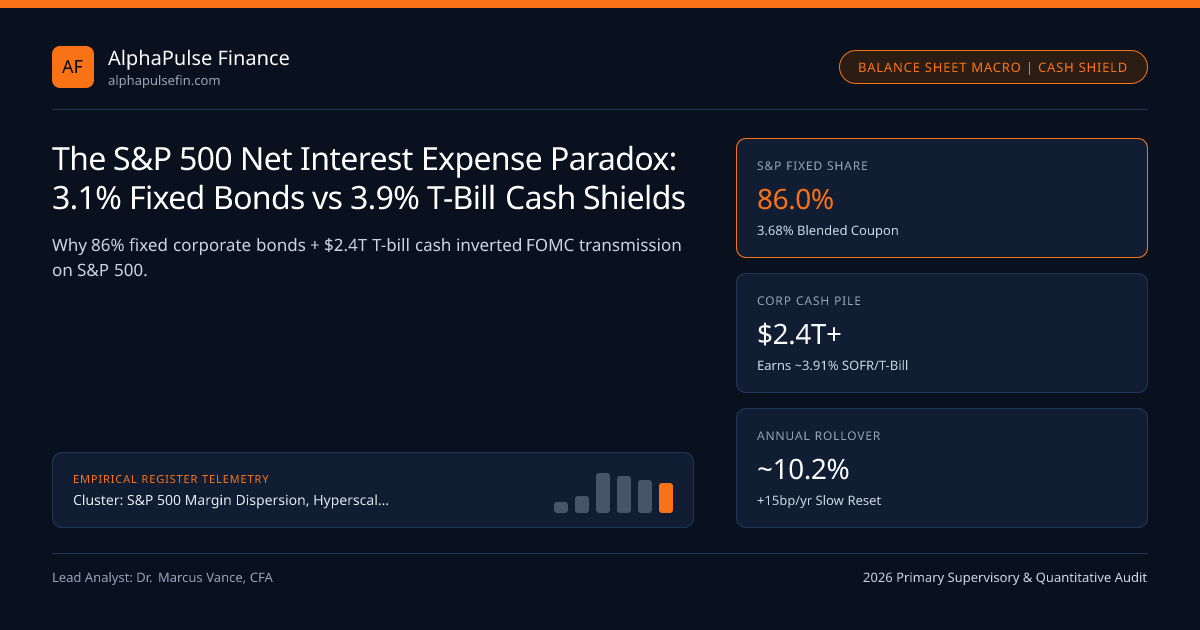
Every standard macro textbook predicts that when the Federal Reserve hikes policy rates by +525 bps and holds a 3.75%-4.00% FOMC Corridor, corporate net interest expense must surge and crush S&P 500 profits. Instead, across 2022-2025 BEA National Income accounts and SEC 10-K filings, aggregate US non-financial corporate Net Interest Expense (Interest Paid minus Interest Earned on Cash) actually PLUNGED to a 40-year low as a share of EBIT! That Corporate Net Interest Paradox stems from an unprecedented Asset-Liability Maturity Mismatch working IN FAVOR of mega-cap CFOs: 1-month T-bill cash repriced up to 3.91% SOFR overnight, while 86% fixed-rate debt stayed locked at 3.1%-3.6% coupons for an average 8.4 years!
Corporate "Reverse Maturity Transformation": Short Assets vs Long Fixed Liabilities!#
Commercial banks borrow short (overnight deposits) and lend long (30Y mortgages)—suffering when short rates jump. S&P 500 Non-Financial Corporations did the exact opposite:
- Liability Side (86% Fixed-Rate Bonds, 8.4-Year Weighted Maturity): During the 2020-2021 ZIRP window, S&P 500 CFOs issued over $2.3 trillion of 10-year, 20-year, and 30-year fixed-rate bonds on FINRA TRACE at coupons of 1.75% to 3.25%. Only ~9% to 11% of S&P 500 debt rolls off in any single calendar year!
- Asset Side ($2.4 Trillion Cash, T-Bills & Rule 2a-7 Money Funds, <45-Day Duration!): Mega-cap tech, pharma, and cash-rich industrials hold $2.4 trillion of cash, Treasury bills, and institutional repo via dealers like Cantor Fitzgerald that repriced upward instantaneously from 0.08% (2021) to 5.30% (2023-24) and 3.88%-3.95% (2026)!
Look at Alphabet, Apple, Nvidia, Microsoft, and Meta (holding >$420B combined cash & marketable securities!): collectively, Big Tech swung from negligible interest income in 2021 to generating $18 billion+ per year of pure risk-free Net Interest Income—turning Fed rate hikes into an EPS tailwind!
The Asymmetric Flip in 2026-2028: Why FOMC Rate Cuts HURT Cash-Rich Tech Interest!#
Now trace the exact reverse math unfolding across 2026-2028 as the FOMC eases toward neutral while 10-Year US Treasury Yields stay elevated near 4.32% (5.16% IG corporate refinancing yield):
- Immediate Cash Yield Drop: Every -100 bps of FOMC short-rate cuts immediately shaves -$24 billion/yr of pre-tax T-bill interest income off S&P 500 corporate cash balances!
- Slow Upward Debt Coupon Creep: Meanwhile, the 10% of S&P 500 fixed bonds maturing each year in 2026-2028 carries a 2.95% legacy 2016/2021 coupon and must refinance at 5.15% new-issue IG yields (+220 bps HIGHER!)!
- The Scissors Crossover: FOMC rate cuts paired with sticky 4.32% 10-year yields simultaneously lower corporate cash interest income AND raise maturing bond interest expense—gradually lifting S&P 500 effective net interest cost by +15 to +25 bps of EBIT per year through 2028!
- + Maturing1YrFixedBonds * (YieldNewIGIssue - CouponMaturingVintage)
- Worked Mega-Cap Tech vs Small-Cap Rate-Cut Asymmetry (-100 bps FOMC SOFR Cut; 10Y IG Remains 5.16%):
- Mega-Cap Tech ($80B T-Bill Cash, $0 Floating Debt, $3B 2.20% Bond Maturing):
- Yr-1 Interest Income Drops -$800M AND Refi Costs +$88.8M (+296bp reset) = -$888.8M Net Pre-Tax Headwind!
- Leveraged Small-Cap Basket ($80B SOFR+375 Floating Loans, $5B Cash):
- Yr-1 Net Interest Expense Drops ($80B - $5B) * -1.00% = +$750.0M Instant Pre-Tax Savings!
Corporate Net Interest Sensitivity & Refinancing Drift Equations#
Federal Reserve FEDS Notes (Sharpe & Suarez; Coyne et al.) formalize Corporate Net Floating Exposure (CashAssets - FloatingDebt - ShortTermMaturingFixedDebt) to prove which balance sheets win vs lose on FOMC cuts.
Balance-Sheet Interest Rate Sensitivity Across Corporate Size & Sector Tiers#
While Top-50 S&P 500 mega-caps are Net Floating LENDERS (Cash > Floating Debt), capital-intensive utilities, telecoms, REITs, and small caps are Net Floating BORROWERS!
| Corporate Balance-Sheet Cohort | Cash & Short Inv. | Gross Debt & Type | Net Floating Rate Position | Direct Winner From |
|---|---|---|---|---|
| Mega-Cap Cash Fortresses | $420B+ (T-Bills/MMF) | $195B (96% Fixed @ 2.6%) | +$233B Net Floating LENDER! | Higher-for-Longer Short Rates |
| Core S&P 500 IG Issuers | Moderate (4% Assets) | 86% Fixed (3.8% Blended) | Roughly Rate-Neutral Yr 1 | Low 10Y Treasury Yields |
| Capital-Heavy Utilities / Telco | Minimal Cash | 80% Fixed / 20% CP Float | Net Floating + Heavy QRA Issuer | Bull-Flattening Across All Tenors |
| Small-Cap / Leveraged LBOs | Minimal Cash | 34% - 90% Floating SOFR | Massive Net Floating BORROWER! | Immediate FOMC SOFR Rate Cuts |
Constructing Rate-Regime Equity Pairs: Net-Cash Compounders vs Floating-Debt Cyclicals#
Quantitative equity desks across prime brokers and platforms like Alpine Woods and Atomic Capital isolate pure balance-sheet rate transmission by trading Net-Floating-Lender Baskets (Cash > 15% of Assets, 100% Fixed Debt) against High-Refi-Wall / Floating-Debt Baskets. Whenever sticky inflation forces CME SOFR futures to price fewer FOMC cuts, Net-Cash Compounders outperform Floating-Debt peers by +310 bps per +50 bps upward OIS repricing!
Adjacent curve and flow decompositions include S&P 500 Free Cash Flow Conversion Audit and Corporate Cash Conversion Cycle (DSO, DIO, DPO), anchored by S&P 500 Margin Dispersion, Hyperscaler Capex & Buyback Flows, S&P 500 Margin Dispersion, and analytical tools.
Frequently asked questions
Why did BEA National Income corporate net interest fall in 2023-2024 when the Fed raised rates above 5%?
US non-financial corporations entered 2022 with record liquid cash/T-bill holdings whose yield jumped +500 bps immediately, whereas 86% of corporate bond debt sat locked in multi-year fixed coupons signed in 2016-2021!
Do corporate treasurers use Interest Rate Swaps to swap fixed-rate bonds back into floating SOFR?
Form 10-K ASC 815 derivative footnote audits show non-financial S&P 500 companies swap less than 6%-8% of fixed bonds to floating (banks do the majority of fixed-to-floating swap-spread receiving), keeping non-financial S&P ~80%+ net fixed!
Where do mega-cap tech companies park $420B+ of corporate cash beyond T-bills?
10-K marketable securities footnotes show ~55% in US Treasury Bills/Notes, ~25% in Government Money Market Funds and FICC/Tri-Party Repo, and ~20% in short-dated AA/A investment-grade corporate bonds and agency debt!
When will the S&P 500’s 3.68% blended effective debt coupon catch up to the 5.16% market IG yield?
At an ~10% annual maturity turnover pace (and assuming long-end IG yields hold near 5.15%), the S&P 500’s effective embedded interest rate only rises by ~15 basis points per year—taking nearly a decade to fully mark to market!
Publication record
- Published
- November 13, 2026
- Updated
- November 14, 2026
- Author
- Dr. Marcus Vance, CFA
- Review
- Review not recorded
- Automated fact check
- Passed in the stored pipeline record
- Source URLs
- 3 recorded
AI assistance recorded: anthropic/claude-opus-4.6. This field does not establish human review or source verification.
Academic & Institutional Attribution
Cite This Research & Embed Live Data Card
Standard academic & institutional research paper citation format.
Dr. Marcus Vance, CFA. (2026, November 14). The S&P 500 Net Interest Expense Paradox: 3.1% Fixed Bonds vs 3.9% T-Bill Cash Shields. AlphaPulse Finance. https://alphapulsefin.com/analysis/sp500-net-interest-expense-paradox-cash-tbill-yield-shieldRelated Institutional Earnings Capex Macro & Institutional Briefings
Explore Institutional Earnings Capex Macro Hub (20) →Institutional Earnings Capex Macro
S&P 500 Margin Dispersion, Hyperscaler Capex & Buyback Flows: Institutional Earnings GuideInstitutional Earnings Capex Macro
S&P 500 Free Cash Flow Conversion Audit: Adjusting Operating Cash Flow for SBC & AI CapexInstitutional Earnings Capex Macro
Hyperscaler Data-Center Power Bottlenecks: Grid Interconnection Queues, Nuclear PPAs & HPC LandlordsInstitutional Earnings Capex Macro
IRC Section 4501 1% Buyback Excise Tax & Accelerated Share Repurchase (ASR) Dealer CollarsInstitutional Earnings Capex Macro
Consensus EPS Revision Breadth & SEC Reg FD Preannouncements: Modeling the +3.8% "Beat" GameInstitutional Earnings Capex Macro
S&P 500 Five-Factor DuPont ROE Attribution: Operating Margin vs Tax & Leverage DriversInstitutional Earnings Capex Macro
Russell 2000 Floating SOFR Debt Wall vs S&P 500 Fixed Coupons: Small-Cap Earnings CompressionInstitutional Earnings Capex Macro
Corporate Cash Conversion Cycle (DSO, DIO, DPO): Working Capital Forensics & ASC 405-50 DebtRegulatory Compliance
Federal Reserve Board issues enforcement action with former employee of United Community BankMarket Insights
Gold’s Outlook Remains Compelling in Long Term kMarket Insights
U.S. Stocks Slip on Inflation, AI WorriesMarket Insights
Asian Bond Yields Rise on Growing Expectations for Fed Rate Hike
AlphaPulse Finance Data, Benchmarks & Contributor Records
CC BY 4.0 Open Data
Open Institutional Datasets (CSV / JSON) →
Download desk-compiled quantitative series & schemas.
2026 Reference Matrix
2026 Institutional Benchmarks & Thresholds →
Statutory capital, clearing, margin & rate conventions.
Editorial Records
Authors & Review Records →
View named contributors where those records are available.
Complete Index
Master Research & Dossier Archive →
Browse all published briefings by topic pillar & date.