
Institutional Earnings Capex Macro
S&P 500 Five-Factor DuPont ROE Attribution: Operating Margin vs Tax & Leverage Drivers
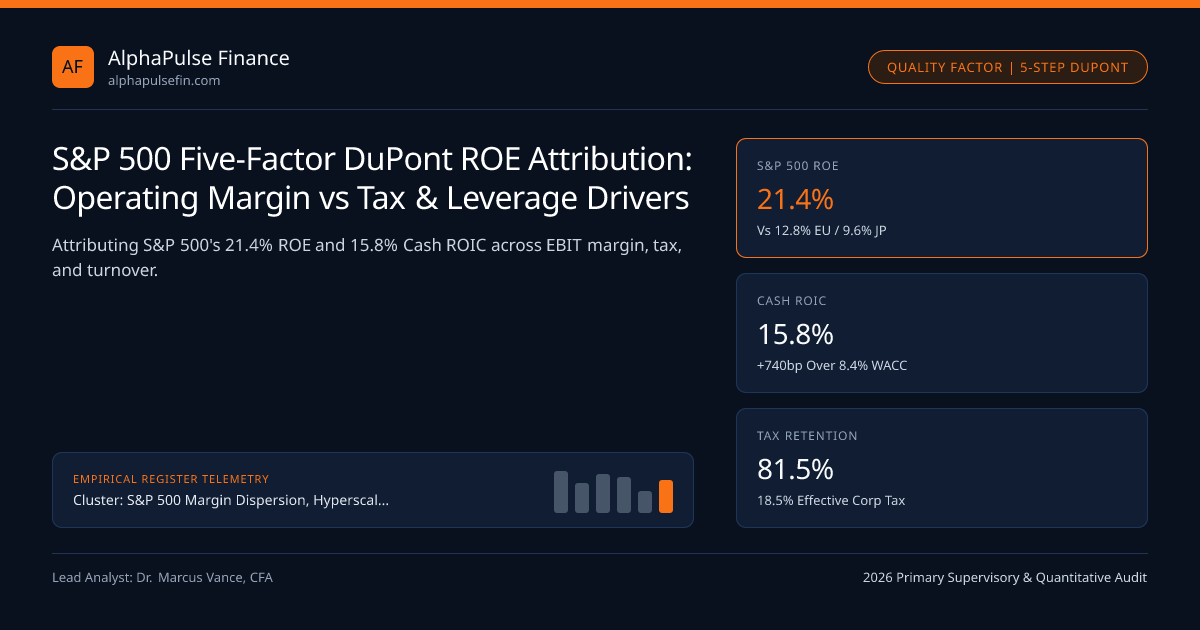
Five-factor DuPont decomposition proves S&P 500 Return on Equity expanded from 14.8% (2010-2016) to 21.4% (2026) via higher EBIT margins and post-TCJA 81.5% tax retention—NOT reckless balance-sheet debt leverage.
Bears staring at the S&P 500's 5.1x Price-to-Book (P/B) multiple—more than double European (2.1x) and Japanese (1.5x) benchmarks—routinely claim US equities are in a historic valuation bubble. They forget the fundamental accounting bridge linking Price-to-Book to Price-to-Earnings: *P/B = P/E ReturnonEquity (ROE)! Because S&P 500 Return on Equity sits near an extraordinary 21.4% (vs ~12.8% in Europe STOXX 600 and ~9.4% in Japan TOPIX!), auditing the Institutional Five-Factor DuPont Identity** across SEC 10-K filings is the single most rigorous test of whether US corporate profitability is structurally durable against 1.98% 10-Year TIPS Real Yields.
Why 5-Factor DuPont Beats Classic 3-Factor DuPont (Separating Debt From Operations!)#
Classic 1919 3-factor DuPont (Net Margin * Asset Turnover * Assets/Equity) mixes operating margin together with interest expense and corporate taxes—making it impossible to see whether a company boosted ROE via operational genius or reckless debt! Institutional equity committees split Net Margin into three distinct pieces to build the Five-Factor DuPont Equation:
- Operating Margin (EBIT / Sales): Pure pre-interest, pre-tax pricing power and cost efficiency (16.9% S&P 500 Ex-Financials vs 13.1% pre-2017!).
- Asset Turnover (Sales / Avg Total Assets): Physical capital velocity (0.69x).
- Interest Burden (EBT / EBIT = 1 - Interest/EBIT): Fraction of EBIT retained after net debt service (0.91x—near a 40-year high thanks to 3.68% fixed bonds and T-bill cash!).
- Tax Retention Ratio (Net Income / EBT = 1 - EffectiveTaxRate): Fraction kept after global corporate taxes (0.815x, reflecting an 18.5% blended effective tax rate after the 2017 TCJA 35%->21% cut + R&D/FDII credits, offset slightly by 15% OECD Pillar Two global minimums!).
- Equity Multiplier (Avg Total Assets / Avg Book Equity): Balance-sheet leverage (2.68x—actually lower than 2005-2007!).
Watch the "Negative Book Equity" Buyback Distortion in S&P 500 DuPont!#
Before taking raw 21.4% S&P 500 Book ROE at face value, forensic analysts at buy-side pods and wealth platforms like Alpine Woods and Atomic Capital correct two massive GAAP Book-Equity distortions:
- Cumulative Share Buybacks Shrink Book Equity Toward Zero (or Negative!): Over 35 S&P 500 blue-chip cash machines (Home Depot, McDonald’s, Starbucks, Lowe’s, Boeing, AutoZone, Philip Morris) bought back so much stock at $250/share (deducted at market price from historical-cost Book Equity!) that their GAAP Stockholders' Equity is near $0 or NEGATIVE—creating nonsensical 450% or -800% ROE!
- Unbooked Intangible R&D Capital (ASC 730 Expensing): GAAP expenses 100% of internal software/pharma R&D immediately rather than capitalizing it onto Book Assets (Peters & Taylor Total Q adjustment). Replacing distorted Book Equity with Return on Invested Capital (ROIC = NOPAT / (Debt + CapitalizedR&D + BookEquityExBuybacks)) yields a rock-solid, distortion-free 15.8% S&P 500 Cash ROIC (more than +740 bps above an ~8.4% WACC anchored to 4.32% 10Y Treasuries!).
- JustifiedPricetoBook = (ROE - gSustainable) / (CostofEquityke - g_Sustainable)
- Worked Valuation Proof Why 21.4% ROE Commands 5.0x Price-to-Book (k_e = 8.8%, g = 5.4%):
- US S&P 500 Justified P/B = (21.4% - 5.4%) / (8.8% - 5.4%) = 16.0% / 3.4% = 4.71x Book!
- Europe STOXX Justified P/B (ROE = 12.8%, k_e = 9.0%, g = 3.8%) = (12.8% - 3.8%) / (9.0% - 3.8%) = 9.0% / 5.2% = 1.73x Book!
Five-Factor DuPont Decomposition & ROIC-to-P/B Valuation Equations#
Quantifying exact percentage-point contributions from 2014 (14.8% ROE) to 2026 (21.4% ROE, +660 bps gain!) proves Operating Margin (+410 bps) and Tax Cut (+195 bps) did 92% of the work!
Global Equity Benchmark 5-Factor DuPont Comparison Matrix (US vs EU vs Japan)#
Look at why US equities trade at higher multiples than Europe (STOXX 600) and Japan (TOPIX) without hand-waving: Europe is heavy in low-ROE banks/autos/utilities (11.8% EBIT margin), while Japan hoards excess 0%-yielding corporate cash (low 1.9x leverage, though TSE <1.0x P/B reforms are finally lifting TOPIX ROE from 8% -> 9.8%!).
| Global Equity Index | EBIT Margin (1) | Asset Turn (2) | Int * Tax (3*4) | Assets/Eq (5) = ROE | Justified P/B Multiple |
|---|---|---|---|---|---|
US S&P 500 (Ex-Fin) | 16.9% | 0.69x | 0.742x (91% * 81.5%) | 2.48x = 21.4% ROE | 4.8x - 5.2x (15.8% ROIC) |
Europe STOXX 600 (Ex-Fin) | 12.1% | 0.66x | 0.685x (Higher Tax) | 2.34x = 12.8% ROE | 2.0x - 2.3x |
Japan TOPIX (Non-Fin) | 8.4% | 0.74x | 0.695x (Low Interest) | 2.22x = 9.6% ROE | 1.4x - 1.7x (Rising on Buybacks) |
US Russell 2000 (Ex-Fin) | 6.8% | 0.78x | 0.540x (SOFR Drag!) | 2.38x = 6.8% ROE | 1.8x - 2.1x (SEC Filers) |
Policy Risk Stress Test: Statutory Corporate Tax Rate & Pillar Two Sensitivity#
Because the Tax Retention Factor (1 - t_eff = 0.815) multiplies the entire DuPont chain directly, every +1.0 percentage point increase in the US statutory or OECD Pillar Two 15% global minimum effective corporate tax rate mechanically trims S&P 500 ROE by -26 bps and S&P 500 EPS by -1.23% dollar-for-dollar!
Execution desks cross-check these sensitivities via Russell 2000 Floating SOFR Debt Wall vs S&P 500 Fixed Coupons, Debt-Funded M&A Accretion Hurdle Rates vs Share Buyback IRR, and S&P 500 Margin Dispersion, Hyperscaler Capex & Buyback Flows, curated on S&P 500 Margin Dispersion and macro benchmarks.
Frequently asked questions
How can companies like Home Depot, Starbucks, or McDonald’s operate safely with NEGATIVE GAAP Stockholders’ Equity?
GAAP carries factories and real estate at depreciated 1990s historical cost while deducting share buybacks at 2025 market prices! Their true economic Enterprise Value exceeds debt by 8x, making GAAP Book Equity an accounting artifact rather than insolvency!
How does capitalizing R&D change the S&P 500’s Return on Invested Capital (ROIC) and Price-to-Book?
Capitalizing 5 years of software/pharma R&D onto the balance sheet (amortized at 20%/yr) adds ~$3.8T of intangible "Knowledge Capital" to S&P 500 Book Equity—lowering optical P/B from 5.1x down to ~3.4x and stabilizing ROIC near 15.8%!
How did the OECD 15% Pillar Two Global Minimum Corporate Tax affect S&P 500 Tech & Pharma tax retention?
Multinationals booking IP profits in low-tax Ireland/Singapore/Switzerland jurisdictions (<10% prior tax) saw foreign effective tax floors rise to 15% across 2024-2026, nudging S&P 500 blended effective taxes up ~60-90 bps from 17.7% toward 18.5%.
Why is Tokyo Stock Exchange’s "P/B < 1.0x Name-and-Shame" reform essentially a DuPont ROE campaign?
TSE forced Japanese boards trading below 1.0x book (ROE < Cost of Equity ~8%) to unwind lazy cross-shareholdings and buy back excess 0%-yielding cash—boosting factors 2 and 5 of DuPont to lift TOPIX ROE past 10%!
Publication record
- Published
- November 13, 2026
- Updated
- November 14, 2026
- Author
- Dr. Marcus Vance, CFA
- Review
- Review not recorded
- Automated fact check
- Passed in the stored pipeline record
- Source URLs
- 3 recorded
AI assistance recorded: anthropic/claude-opus-4.6. This field does not establish human review or source verification.
Academic & Institutional Attribution
Cite This Research & Embed Live Data Card
Standard academic & institutional research paper citation format.
Dr. Marcus Vance, CFA. (2026, November 14). S&P 500 Five-Factor DuPont ROE Attribution: Operating Margin vs Tax & Leverage Drivers. AlphaPulse Finance. https://alphapulsefin.com/analysis/sp500-dupont-roe-attribution-operating-margin-tax-leverageRelated Institutional Earnings Capex Macro & Institutional Briefings
Explore Institutional Earnings Capex Macro Hub (20) →Institutional Earnings Capex Macro
S&P 500 Margin Dispersion, Hyperscaler Capex & Buyback Flows: Institutional Earnings GuideInstitutional Earnings Capex Macro
Russell 2000 Floating SOFR Debt Wall vs S&P 500 Fixed Coupons: Small-Cap Earnings CompressionInstitutional Earnings Capex Macro
Corporate Cash Conversion Cycle (DSO, DIO, DPO): Working Capital Forensics & ASC 405-50 DebtInstitutional Earnings Capex Macro
DXY Dollar Strength & S&P 500 Foreign Revenue: FX Translation vs ASC 815 Cash-Flow HedgingInstitutional Earnings Capex Macro
GAAP vs Non-GAAP S&P 500 EPS Wedge (+14.5%): SEC Regulation G & Item 10(e) EnforcementInstitutional Earnings Capex Macro
Hyperscaler Incremental AI ROIC vs WACC: The $600B Cloud & Enterprise Monetization HurdleInstitutional Earnings Capex Macro
Implied S&P 500 Equity Risk Premium: Cash-Payout FCF Yield vs 10-Year TIPS Real YieldsInstitutional Earnings Capex Macro
Debt-Funded M&A Accretion Hurdle Rates vs Share Buyback IRR: Exposing the EPS Accretion FallacyMarket Insights
Stock Market Today: Nasdaq Jumps After CoreWeave EarningsInflation Rates
Prices rose by 0.4% in October from the previous month, the Labor Department said, higher than expectedMarket Insights
Stocks Move Lower as Inflation Remains ElevatedMarket Insights
The Nvidia Affair Is Terrible Timing for Corporate America
AlphaPulse Finance Data, Benchmarks & Contributor Records
CC BY 4.0 Open Data
Open Institutional Datasets (CSV / JSON) →
Download desk-compiled quantitative series & schemas.
2026 Reference Matrix
2026 Institutional Benchmarks & Thresholds →
Statutory capital, clearing, margin & rate conventions.
Editorial Records
Authors & Review Records →
View named contributors where those records are available.
Complete Index
Master Research & Dossier Archive →
Browse all published briefings by topic pillar & date.