
Institutional Earnings Capex Macro
Debt-Funded M&A Accretion Hurdle Rates vs Share Buyback IRR: Exposing the EPS Accretion Fallacy
With investment-grade corporate bond yields near 5.16% (4.08% after 21% tax shield), investment bankers can structure debt-funded acquisitions up to 24.5x target P/E as Day-1 EPS accretive even when deal ROIC destroys shareholder value.
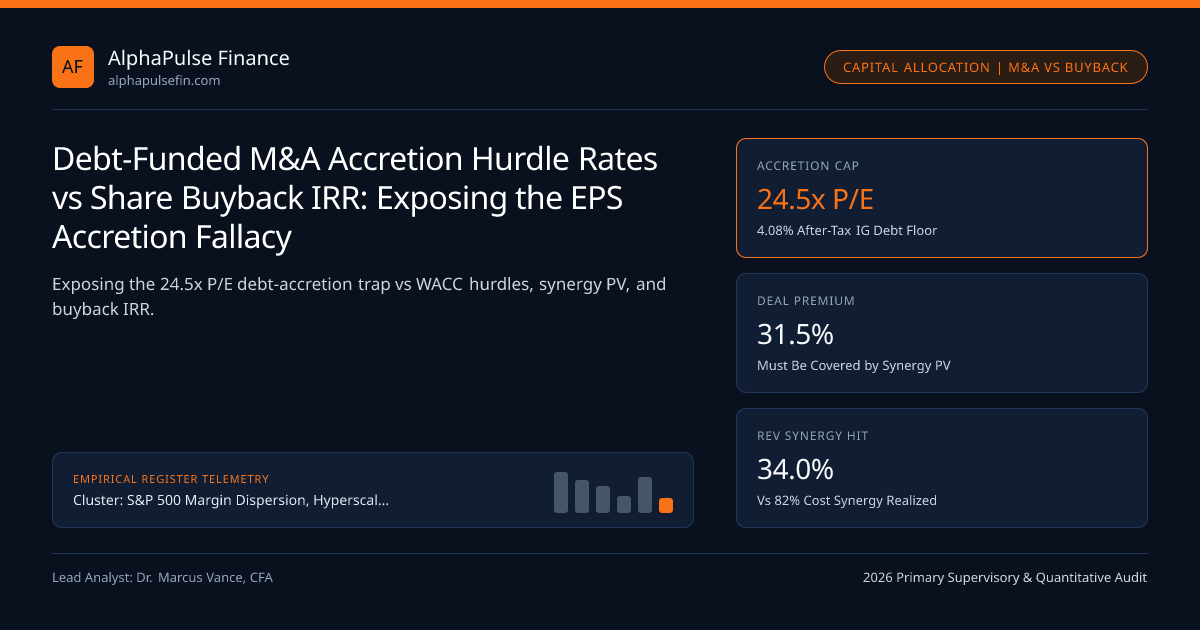
Boardroom M&A pitchbooks routinely celebrate a multi-billion-dollar cash acquisition as "Immediately +6% Accretive to Year-1 Non-GAAP EPS!"—yet the acquirer’s stock frequently plunges -8% on announcement day. Why do institutional portfolio managers sell "accretive" deals? Because whenever an investment-grade acquirer borrows 10-year senior notes at 5.16% (4.32% 10-Year US Treasury + 84 bps OAS), its *after-tax cost of debt (5.16% (1 - 0.21) = 4.08%) sets a mathematical 24.5x P/E accretion ceiling (1 / 4.08%)*: buying any* business below 24.5x P/E with debt boosts EPS mechanically, even if the deal earns a 5.2% ROIC far below an 8.8% WACC!
Mathematical Proof of the Debt-Funded EPS Accretion Fallacy#
In a 100% debt-financed or excess-cash-financed acquisition (where cash otherwise earned 3.91% Overnight SOFR), the acquirer’s own stock P/E multiple is completely irrelevant to Day-1 EPS accretion! Accretion occurs strictly whenever:
*Target Earnings Yield (ETarget / Purchase Equity Price) > After-Tax Cost of Acquisition Debt (rd (1 - t))**
At a 5.16% IG bond coupon (printed on FINRA TRACE) and 21% statutory tax shield (4.08% after-tax cost), acquiring a stagnant utility or legacy software target at 22.0x P/E (4.55% earnings yield, including 30% takeover premium!) adds +47 bps of net spread per dollar borrowed—boosting pro-forma EPS! Yet that target’s unlevered after-tax operating return (ROIC = 4.55%) sits -425 bps below the deal’s 8.80% risk-adjusted WACC, destroying billions in intrinsic NPV while levering up the acquirer’s balance sheet (which compresses the acquirer’s P/E multiple to offset the higher EPS!).
Stock-for-Stock M&A Breakeven (P/E_Acquirer > P/E_Target) and Synergy Capitalization#
In an all-stock merger governed by SEC Form S-4 proxy registration, the accretion hurdle flips to relative valuation: an all-stock deal is Day-1 EPS accretive (pre-synergies) if and only if the Acquirer’s P/E exceeds the Target’s Offer-Price P/E. When a 32x-P/E mega-cap swaps stock to acquire a 20x-P/E target, EPS rises mechanically (the 1960s conglomerate "bootstrapping" illusion), yet true value creation still depends exclusively on whether Present Value of Realized After-Tax Cost & Revenue Synergies exceeds the Cash Control Premium Paid (typically 28%–35% over unaffected market cap).
- NetPresentValueAcquirer = PVAfterTaxSynergies - (CashOfferPrice - UnaffectedTargetStandaloneValue) - DealAdvisoryFees
- Worked $5.0B Cash Acquisition Audit ($3.8B Standalone Value + $1.2B [31.6%] Takeover Premium, Debt at 5.16%):
- Banker Pitch: Target earns $230M NI (21.7x Offer P/E < 24.5x cap) -> After-tax interest = $5B * 4.08% = $204M -> +$26M Day-1 EPS Accretion!
- Economic Reality: Management promises $75M pre-tax cost synergies ($59.3M after tax, worth $673M at 8.8% WACC):
- Acquirer Shareholder NPV = $673M Synergy PV - $1,200M Premium Paid - $65M Fees = -$592M Immediate Market-Cap Loss!
Benchmarking Deal ROIC Against the Share Buyback IRR Opportunity Cost#
Activist hedge funds and disciplined capital allocators (Constellation Software, Danaher, Roper, AutoZone) force corporate development teams to clear two simultaneous capital-allocation hurdles before signing an M&A merger agreement:
- Absolute Risk Hurdle (Year-3 Synergized Deal ROIC > Target WACC + 150 bps Execution Buffer): Accounts for empirical evidence that acquirers over-estimate revenue synergies by 60% and suffer integration talent attrition.
- Zero-Integration Opportunity Cost Hurdle (Deal IRR > Own-Stock Share Buyback IRR): Buying back your own shares incurs 0% control premium, 0% integration disruption, 0% antitrust litigation risk, and only a 1.0% IRC Section 4501 excise tax! If an acquirer’s own stock trades at an 11.2% Free-Cash-Flow-plus-Growth IRR, paying a 35% takeover premium for a rival at a 9.1% M&A IRR misallocates shareholder capital even though 9.1% marginally clears WACC!
Goodwill Impairment Hangovers (ASC 350) and Post-Deal ROIC Denominator Discipline#
Watch out for CEOs who impair $4 billion of acquisition Goodwill three years after an overpriced deal under FASB ASC 350, and then brag in Year 4 that "ROIC jumped +400 bps!" Forensic buy-side models add cumulative historical Goodwill write-offs back into Invested Capital permanently so management remains accountable for every dollar of shareholder capital ever spent on M&A.
| Capital Allocation Path | Mechanical EPS Impact | Control Premium Paid | Integration & Regulatory Risk | True Value Creation Condition |
|---|---|---|---|---|
| 100% Debt-Funded Cash M&A | Accretive if Target P/E < 24.5x | 28% - 38% Cash Premium | High (Leverage + FTC HSR) | PV(After-Tax Synergies) > Cash Premium |
| 100% Stock-Swap Merger (SEC S-4) | Accretive if Acquirer P/E > Offer P/E | 20% - 30% Exchange Ratio | High (Shareholder vote + dilution) | Acquirer currency overvalued vs synergies |
| Open-Market Share Buyback | Accretive if Stock E/P > Cash Rate | 0.0% Premium (+1% Tax) | Zero (Instant execution) | Execution Price < Intrinsic DCF Value |
Floating Debt Paydown (SOFR) | Accretive if Loan Rate > Cash Rate | 0.0% Premium | Zero (De-risks equity beta) | Guarantees 6.5%-7.5% risk-free return! |
Capital Allocation Decision Matrix: M&A vs Buybacks vs Debt Paydown#
Investment banking M&A fairness opinions (disclosed in SEC Schedule 14A / Form S-4) and syndicate bridge loans structured by dealers like Cantor Fitzgerald, Atomic Capital, and Bridgetower Capital are audited against strict unlevered ROIC hurdles.
Compare parallel plumbing dynamics in Earnings-Day Single-Stock Implied Straddles & S&P and The S&P 500 Net Interest Expense Paradox, framed by S&P 500 Margin Dispersion, Hyperscaler Capex & Buyback Flows, S&P 500 Margin Dispersion, and quantitative methodology.
Frequently asked questions
Why do management compensation plans tied solely to "Adjusted EPS Growth" incentivize value-destroying M&A?
If a CEO’s LTIP bonus vests purely on 3-year Non-GAAP EPS growth (without an ROIC gate!), borrowing 5.16% bonds to buy mediocre companies at 20x P/E while adding back ASC 805 amortization guarantees maximum CEO bonuses while cratering ROIC!
Where in SEC filings can investors read the investment bank’s actual DCF valuation of an M&A target?
Look up the "Background of the Merger" and "Opinion of Financial Advisor" sections inside SEC Schedule 14A (cash merger proxy) or Form S-4 (stock merger)—which legally disclose the exact WACC, terminal multiples, and management projections used!
When is a DILUTIVE Day-1 acquisition actually massively value-creating for shareholders?
Buying a hyper-growth software or medtech disruptor at 45x Year-1 earnings (Day-1 EPS dilutive!) creates massive NPV if its revenues compound +35%/yr into the acquirer’s global distribution network, driving Year-4 ROIC past 22% (e.g., Facebook buying Instagram or Google buying YouTube/Android)!
Why must analysts add past ASC 350 Goodwill write-downs back into Invested Capital when scoring serial acquirers?
Writing off $3B of overpaid M&A Goodwill shrinks accounting Invested Capital on the balance sheet—artificially boosting future reported ROIC (NOPAT / Shrunken IC) and erasing management’s historical capital-allocation mistakes!
Publication record
- Published
- November 12, 2026
- Updated
- November 14, 2026
- Author
- Dr. Marcus Vance, CFA
- Review
- Review not recorded
- Automated fact check
- Passed in the stored pipeline record
- Source URLs
- 3 recorded
AI assistance recorded: anthropic/claude-opus-4.6. This field does not establish human review or source verification.
Academic & Institutional Attribution
Cite This Research & Embed Live Data Card
Standard academic & institutional research paper citation format.
Dr. Marcus Vance, CFA. (2026, November 14). Debt-Funded M&A Accretion Hurdle Rates vs Share Buyback IRR: Exposing the EPS Accretion Fallacy. AlphaPulse Finance. https://alphapulsefin.com/analysis/debt-funded-ma-accretion-hurdle-rates-vs-share-buyback-irrRelated Institutional Earnings Capex Macro & Institutional Briefings
Explore Institutional Earnings Capex Macro Hub (20) →Institutional Earnings Capex Macro
S&P 500 Margin Dispersion, Hyperscaler Capex & Buyback Flows: Institutional Earnings GuideInstitutional Earnings Capex Macro
Earnings-Day Single-Stock Implied Straddles & S&P 500 Dispersion Volatility MechanicsInstitutional Earnings Capex Macro
ASC 715 Corporate Pension Surpluses & Pension Risk Transfer (PRT) Buyouts: Industrial EPS QualityInstitutional Earnings Capex Macro
Nominal GDP Deceleration & S&P 500 Margins: Decomposing Price/Mix vs Real Unit Volume LeverageInstitutional Earnings Capex Macro
S&P 500 Operating Leverage Dispersion: Cap-Weighted Mega-Cap vs Equal-Weighted EBIT MarginsInstitutional Earnings Capex Macro
Hyperscaler AI GPU Useful-Life Accounting: 4-to-6-Year Server Depreciation Cliffs & EBIT RiskInstitutional Earnings Capex Macro
SEC Rule 10b5-1 Buyback Amendments & Quarterly Earnings Blackout Liquidity WindowsInstitutional Earnings Capex Macro
The S&P 500 Net Interest Expense Paradox: 3.1% Fixed Bonds vs 3.9% T-Bill Cash ShieldsMarket Insights
China Producer Inflation Accelerates to Over Four-Year HighMarket Insights
Gold Rises Above $4,100 an Ounce, With Focus on U.S. Inflation DataMarket Insights
Stock futures rise slightly as investors eye AI trade, brace for more data and earnings: Live updatesMonetary Policy
Cook, The Dual Mandate in Rural America
AlphaPulse Finance Data, Benchmarks & Contributor Records
CC BY 4.0 Open Data
Open Institutional Datasets (CSV / JSON) →
Download desk-compiled quantitative series & schemas.
2026 Reference Matrix
2026 Institutional Benchmarks & Thresholds →
Statutory capital, clearing, margin & rate conventions.
Editorial Records
Authors & Review Records →
View named contributors where those records are available.
Complete Index
Master Research & Dossier Archive →
Browse all published briefings by topic pillar & date.