
Institutional Earnings Capex Macro
S&P 500 Operating Leverage Dispersion: Cap-Weighted Mega-Cap vs Equal-Weighted EBIT Margins
With Top-10 constituents commanding ~36% of S&P 500 market cap and 28.6% net margins, cap-weighted operating leverage masks flat 10.9% equal-weighted margins whenever nominal revenue growth dips below 4.5%.
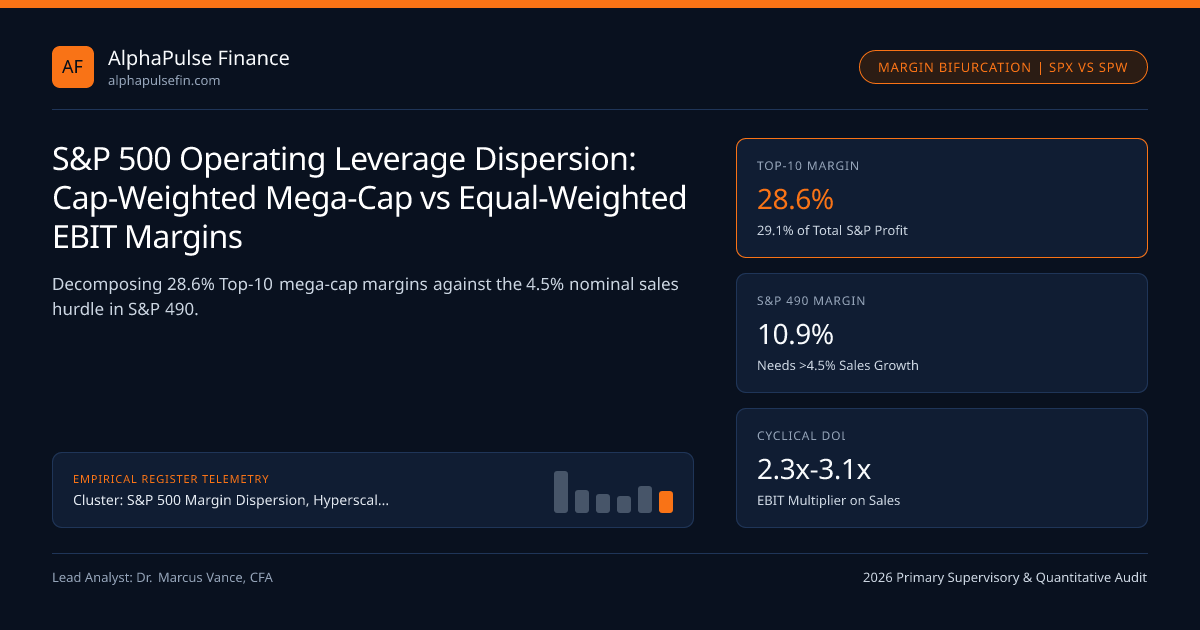
Evaluating "corporate America" solely through the market-cap-weighted S&P 500 (SPX) versus the equal-weighted S&P 500 (SPW) produces two completely different economic diagnoses in 2026. Because the Top 10 constituents command ~36% of market capitalization and ~29% of index net income with 68% gross margins, cap-weighted S&P 500 EPS compounds at +11% even while the median S&P 490 industrial, consumer, and healthcare company grinds out +4.5% revenue growth against ~3.7% wage inflation anchored to BEA Core PCE and Federal Reserve real-growth constraints. Mastering Degree of Operating Leverage (DOL) separates genuine margin expansion from index concentration optics.
Degree of Operating Leverage (DOL): Fixed vs Variable Cost Structure by Sector#
Microeconomic Degree of Operating Leverage (DOL = % Change in EBIT / % Change in Revenue = Contribution_Margin / EBIT) measures how violently operating profits swing for every 1% acceleration or deceleration in top-line sales:
- High-Gross-Margin Software & Semis (Gross Margin 68%-76%, DOL = 1.8x to 2.4x Upside): Once R&D engineering salaries are covered, each incremental dollar of cloud/AI license revenue drops 72 cents straight to EBIT! A +15% revenue beat translates into a +28% to +34% EBIT surge reported on SEC Form 10-Q!
- Capital-Heavy Industrials, Airlines & Semiconductors Foundries (High Fixed Depreciation/Labor, DOL = 2.6x to 3.8x Two-Way!): High fixed plant depreciation works both ways: if nominal sales slow from +6% to +1%, a 3.2x DOL industrial suffers an immediate -16% EBIT contraction!
- Low-Margin Staples & Retail Distribution (Gross Margin 22%-28%, DOL = 1.3x, Thin Cushion): Variable COGS moves with sales, but even a +80-bps wage/shrinkage cost creep wipes out 15% of narrow 5.5% operating margins!
The 4.5% Nominal Revenue Breakeven Rule for S&P 490 Equal-Weight Margins#
Regressing 35 years of quarterly S&P 500 Ex-Financials Equal-Weight EBIT margins against US Nominal GDP Growth (Real GDP + GDP Deflator) uncovers an ironclad institutional threshold:
- Because corporate fixed SG&A, rent, commercial insurance, and base white-collar salaries grow structurally at ~3.8% to 4.4% per year, Equal-Weighted S&P 500 operating margins ONLY expand when top-line nominal sales grow faster than +4.5% YoY!
- Whenever US disinflation pulls nominal GDP growth down from 6.5% (2022-2024) toward 4.0% to 4.3%, the S&P 490 hits a margin ceiling—explaining why cap-weighted SPX (powered by secular AI revenue shifts unrelated to broad GDP) outperforms Equal-Weight SPW unless real cyclical manufacturing re-accelerates against stable 10-Year TIPS Real Yields (1.98%)!
- DeltaEBITMarginbps = [ (GrossMargin - CurrentEBITMargin) * (RevGrowth - FixedOpExGrowth) ] / (1 + RevGrowth)
- Worked S&P 490 vs Mega-Cap Margin Sensitivity to Slowing 4.0% Nominal Sales (Fixed OpEx Growing +4.3%):
- S&P 490 (Gross Margin = 37%, EBIT Margin = 14%):
- DeltaEBITMargin = (0.37 - 0.14) * (0.040 - 0.043) / 1.04 = -6.6 bps margin CONTRACTION!
- Mega-Cap Software (Sales +13.5%, Fixed R&D/SG&A +9.0%, Gross = 71%, EBIT = 35%):
- DeltaEBITMargin = (0.71 - 0.35) * (0.135 - 0.090) / 1.135 = +142.7 bps margin EXPANSION!
Contribution Margin, DOL Elasticity & Breakeven Sales Growth Equations#
Computing sector-specific Margin-Maintenance Revenue Hurdles lets portfolio managers on platforms like Alpine Woods and Atomic Capital rotate between SPX and SPW ahead of ISM Manufacturing inflections.
S&P 500 Sector Operating Leverage & Margin Dispersion Matrix (Q4 2026)#
Notice the 1,770-bps Net Margin Chasm between Top-10 Mega-Cap Tech/Comm Services (28.6%) and Equal-Weighted S&P 490 (10.9%)—wider than the 2000 Dot-Com peak, EXCEPT that 2026 mega-caps back their market-cap weight with 29% of actual realized cash earnings (whereas 2000 tech traded on eyeballs without cash flow!).
| Index / Equity Cohort | Tech + Comm Weight | Gross / Net Margin | Sales Needed to Expand Margin | Winning Macro Backdrop |
|---|---|---|---|---|
S&P 500 Cap-Weight (SPX) | ~41.5% | 48.2% / 13.4% | Secular AI Cycle (Decoupled) | Moderate GDP (3.8%-4.8%) + Stable Rates |
S&P 500 Equal-Weight (SPW) | ~17.8% | 37.4% / 10.9% | >= +4.5% Nominal GDP | ISM PMI > 52 + Bull-Steepening Curve |
| Top-10 Mega-Cap Basket | 85.0%+ | 69.5% / 28.6% | >= +6.5% (R&D Scaling) | Narrow Growth Scarcity + Global AI Capex |
| S&P 600 / Russell 2000 | ~12.5% | 31.2% / 3.9% | >= +5.5% + Rate Cuts! | Aggressive FOMC SOFR Cuts (Cantor) |
Macro Catalysts That Flip Equal-Weight (RSP) Ahead of Cap-Weight (SPY)#
Equal-Weight S&P 500 (SPW / RSP) systematically beats Cap-Weight (SPX / SPY) by +450 to +800 bps annualized ONLY when three macro conditions align simultaneously: (1) ISM Manufacturing PMI crosses above 52.0 (igniting 3.0x industrial DOL upside!), (2) 2s10s Treasury/Real curves bull-steepen via FOMC rate cuts (lifting Equal-Weight’s 2.2x heavier regional bank/financials weight), and (3) Hyperscaler AI capex deceleration narrows Top-10 EPS growth superiority below +400 bps over the S&P 490.
Cross-market desks pair these thresholds with S&P 500 Margin Dispersion, Hyperscaler Capex & Buyback Flows, Hyperscaler AI GPU Useful-Life Accounting, and Consensus EPS Revision Breadth & SEC Reg FD Preannouncements inside our S&P 500 Margin Dispersion archive and macro benchmarks directory.
Frequently asked questions
Why does disinflation sometimes HURT S&P 500 Equal-Weight corporate profit margins?
During 2021-2023 inflation, companies raised output sticker prices +7% immediately while lagging multi-year wage contracts rose +4%, boosting margins! When goods inflation drops back to 0%-1% while lagged service/healthcare wages still grow +3.8%, negative operating leverage squeezes the S&P 490!
How does the sector weight of Equal-Weight S&P 500 (RSP) differ from Cap-Weight S&P 500 (SPY)?
Assigning 0.20% strictly to each of the 500 companies slashes Information Technology weight by more than half (~32% down to ~14%) while doubling Industrials, Materials, Real Estate, and Utilities weights!
Why do semiconductor manufacturers have higher downside operating leverage than pure SaaS software companies?
Both enjoy 60%-75% gross margins in booms, but wafer fabs carry billions in non-cancelable 5-year lithography depreciation and cleanroom power costs (DOL > 3.0x), whereas SaaS firms can freeze hiring and cloud instances faster.
Where do analysts track quarterly macro corporate profit margins across ALL US private and public firms vs S&P 500?
BEA’s quarterly National Income and Product Accounts (NIPA Corporate Profits After Tax as a % of GDP, released with the second GDP estimate) tracks all tax-filing C-corps, capturing private middle-market margin squeeze invisible in mega-cap S&P 500!
Publication record
- Published
- November 13, 2026
- Updated
- November 14, 2026
- Author
- Dr. Marcus Vance, CFA
- Review
- Review not recorded
- Automated fact check
- Passed in the stored pipeline record
- Source URLs
- 3 recorded
AI assistance recorded: anthropic/claude-opus-4.6. This field does not establish human review or source verification.
Academic & Institutional Attribution
Cite This Research & Embed Live Data Card
Standard academic & institutional research paper citation format.
Dr. Marcus Vance, CFA. (2026, November 14). S&P 500 Operating Leverage Dispersion: Cap-Weighted Mega-Cap vs Equal-Weighted EBIT Margins. AlphaPulse Finance. https://alphapulsefin.com/analysis/sp500-operating-leverage-cap-weight-vs-equal-weight-marginsRelated Institutional Earnings Capex Macro & Institutional Briefings
Explore Institutional Earnings Capex Macro Hub (20) →Institutional Earnings Capex Macro
S&P 500 Margin Dispersion, Hyperscaler Capex & Buyback Flows: Institutional Earnings GuideInstitutional Earnings Capex Macro
Hyperscaler AI GPU Useful-Life Accounting: 4-to-6-Year Server Depreciation Cliffs & EBIT RiskInstitutional Earnings Capex Macro
SEC Rule 10b5-1 Buyback Amendments & Quarterly Earnings Blackout Liquidity WindowsInstitutional Earnings Capex Macro
The S&P 500 Net Interest Expense Paradox: 3.1% Fixed Bonds vs 3.9% T-Bill Cash ShieldsInstitutional Earnings Capex Macro
S&P 500 Free Cash Flow Conversion Audit: Adjusting Operating Cash Flow for SBC & AI CapexInstitutional Earnings Capex Macro
Hyperscaler Data-Center Power Bottlenecks: Grid Interconnection Queues, Nuclear PPAs & HPC LandlordsInstitutional Earnings Capex Macro
IRC Section 4501 1% Buyback Excise Tax & Accelerated Share Repurchase (ASR) Dealer CollarsInstitutional Earnings Capex Macro
Consensus EPS Revision Breadth & SEC Reg FD Preannouncements: Modeling the +3.8% "Beat" GameMarket Insights
U.S. Stocks Gain After CoreWeave Update Eases Some AI ConcernsEarnings Reports
Brookfield Earnings Buoyed by Fund Raising, Wealth Solutions GrowthMonetary Policy
The Inflation Fight May Be About to Turn PainfulRegulatory Compliance
Federal Reserve Board issues enforcement action with former employee of United Community Bank
AlphaPulse Finance Data, Benchmarks & Contributor Records
CC BY 4.0 Open Data
Open Institutional Datasets (CSV / JSON) →
Download desk-compiled quantitative series & schemas.
2026 Reference Matrix
2026 Institutional Benchmarks & Thresholds →
Statutory capital, clearing, margin & rate conventions.
Editorial Records
Authors & Review Records →
View named contributors where those records are available.
Complete Index
Master Research & Dossier Archive →
Browse all published briefings by topic pillar & date.