
Institutional Earnings Capex Macro
ASC 715 Corporate Pension Surpluses & Pension Risk Transfer (PRT) Buyouts: Industrial EPS Quality
Higher AA corporate discount rates lifted S&P 500 defined-benefit pensions to a 103.5% aggregate funded surplus, generating non-operating ASC 715 income boosts and $48B+ of Pension Risk Transfer annuity buyouts.
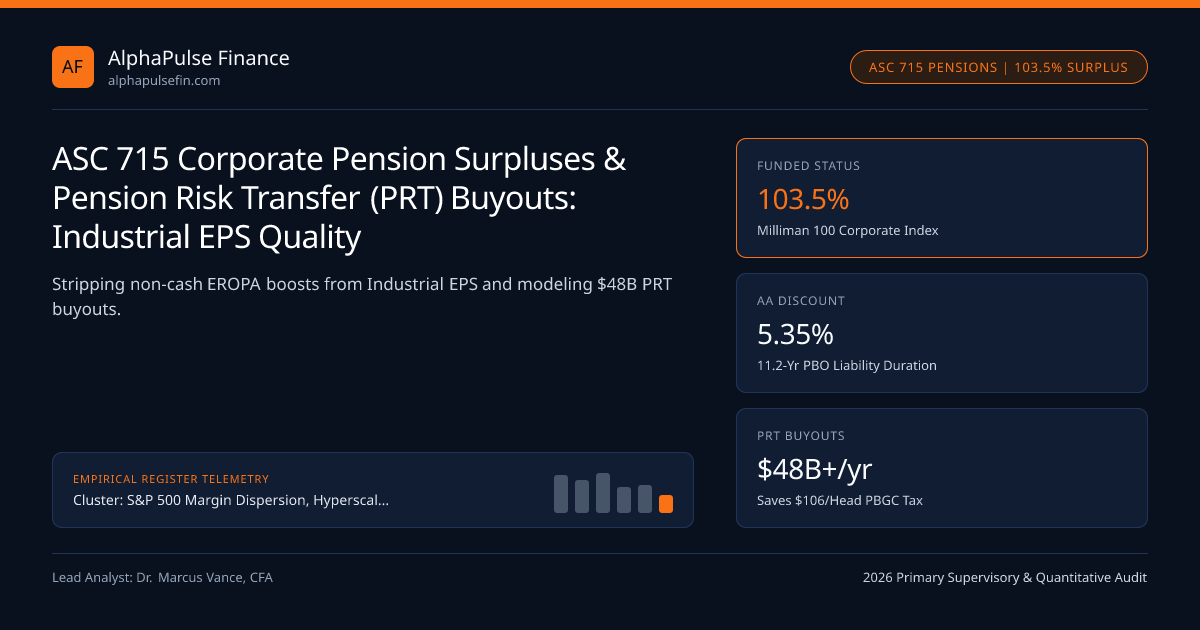
For nearly fifteen years following 2008, ultra-low bond yields crushed corporate defined-benefit pension discount rates toward 2.6%, Saddling legacy S&P 500 aerospace, automotive, utility, and telecom titans with a $390 billion aggregate underfunded pension hole. Higher long-end yields anchored to 30-Year US Treasury Bonds and 5.35% AA Corporate Discount Curves flipped that math upside down: the Milliman 100 Corporate Pension Funding Index sits near a 103.5% funded surplus (~$1.38T assets vs ~$1.33T Projected Benefit Obligations), injecting subtle non-operating ASC 715 pension credits into GAAP earnings and fueling $48 billion+/yr in Pension Risk Transfer (PRT) group annuity buyouts.
How +100 Bps in AA Corporate Yields Shrinks Projected Benefit Obligations (PBO) by -11%#
Under FASB ASC 715 (Compensation—Retirement Benefits), a corporation’s Projected Benefit Obligation (PBO) is discounted not by its own credit rating or expected equity returns, but strictly by a high-quality AA-rated corporate bond yield curve (FTSE Pension Liability Curve / Mercer Yield Curve, averaging ~5.35% alongside 10-Year US Treasuries).
Because retiree annuity promises carry a 10.5-to-12.5-year actuarial duration, rising rates from 2.75% (2021) to 5.35% slashed PBO liabilities by roughly -26%! Even when plan bond portfolios dropped in tandem under Liability-Driven Investing (LDI), plans holding 35%–45% in equities and private credit saw assets compound while liabilities collapsed—eliminating mandatory ERISA cash pension contributions and boosting Industrial Free Cash Flow.
ASU 2017-07 Income-Statement Geography & The Expected Return on Plan Assets (EROPA) Illusion#
Prior to FASB ASU 2017-07, companies bundled every line of Net Periodic Benefit Cost straight into Operating Income (EBIT)—allowing industrials to fabricate higher "operating margins" simply by hiking their assumed Expected Return on Plan Assets (EROPA, e.g., assuming 7.25%/yr!). Under current ASC 715 rules enforced by the SEC:
- Service Cost (new benefits earned by active workers this year): Remains inside Operating Income (COGS / SG&A) as real labor compensation.
- *Interest Cost (5.35% PBO), EROPA (-6.65% * Plan Assets), & Actuarial Amortization: Must be reported below Operating Income** inside Other Non-Operating Income/Expense!
Watch the per-share EPS trap: when a $25B overfunded aerospace pension assumes a 6.80% EROPA ($1.70B credit) against a 5.35% Interest Cost on $23B of PBO ($1.23B charge), the $470 million net spread flows straight into GAAP Pre-Tax Income and Diluted EPS, even if actual pension assets lost -2% in the market that year (smoothed over 5 years in AOCI, unless mark-to-market accounting is used!)!
- EnterpriseValueAdjusted = MarketCap + FinancialDebt - UnrestrictedCash + MAX(0, TaxAdjustedUnfundedPBO)
- Worked Industrial Valuation Clean-Up ($28B Plan Assets at 6.80% EROPA, $25B PBO at 5.35% AA Rate, Reported EPS = $8.00, 1B Shares):
- Non-Cash Non-Operating Pension Credit = ($28B * 6.80%) - ($25B * 5.35%) = $1,904M - $1,338M = +$566M Pre-Tax (+$0.45/sh After Tax!)
- Clean Core Industrial EPS (ex-EROPA smoothing) = $8.00 - $0.45 = $7.55/sh (Avoids paying 18x P/E = $8.10/sh for trapped trust returns!)
Mark-to-Market ("Immediate Recognition") Q4 Accounting vs Corridor Smoothing#
Roughly a third of major legacy plan sponsors (AT&T, Verizon, UPS, Honeywell, IBM) abandoned 10%-corridor AOCI smoothing in favor of Mark-to-Market (MTM) Pension Accounting: they still book smoothed EROPA inside quarterly Non-GAAP EPS across Q1–Q3, and then dump the entire year’s multi-billion-dollar actuarial variance into a Q4 GAAP "One-Time Remeasurement Adjustment" excluded from Non-GAAP EPS! Forensic analysts strip both quarterly EROPA credits and Q4 MTM swings out of core industrial P/E multiples.
The $48B+/Yr Pension Risk Transfer (PRT) Boom & PBGC Premium Arbitrage#
Why are CFOs at IBM, Lockheed Martin, GM, and Alcoa rushing to hand overfunded pension slices to life insurers (Prudential, MetLife, Athene, MassMutual) at 101%–103% of PBO? PBGC Variable & Flat-Rate Headcount Taxes! The Pension Benefit Guaranty Corporation charges $106 per participant every single year regardless of surplus! Offloading 40,000 small-balance retirees (<$25,000 benefit each) eliminates $4.24M/yr of deadweight PBGC fees forever while removing equity-beta volatility from the corporate balance sheet—though transferring plan obligations triggers a one-time GAAP ASC 715 Settlement Charge (reclassifying historical AOCI losses through Net Income).
| ASC 715 Pension Line / Event | Income-Statement Geography (ASU 2017-07) | Cash Flow Reality | In-Slice Regulatory / Market Link | Forensic Valuation Adjustment |
|---|---|---|---|---|
| Active Service Cost | Inside Operating Income (EBIT) | Real deferred labor wage | SEC Form 10-K Footnote | Keep inside core operating NOPAT |
Net EROPA - Interest Cost Credit | Below EBIT (Other Non-Op Income) | Zero Cash (Locked in ERISA trust!) | Cantor Fitzgerald LDI Curves | Strip out of Operating EPS! |
| PRT Group Annuity Settlement | One-time Non-Op Settlement Charge | Eliminates $106/head PBGC cash fee | NYSDFS Regulated Life Insurers | Ignore GAAP AOCI charge; reward de-risking |
| DB Surplus -> 401(k) Replacement | Replaces cash 401(k) match expense! | Saves $300M-$550M/yr real cash! | IRS IRC Sec 420 / Reopened Cash-Balance | Legitimate multi-year FCF uplift (IBM) |
Pension Accounting, LDI Hedging & Annuity Buyout Governance Matrix#
Corporate pension investment committees coordinate LDI long-bond duration overlays, ERISA fiduciary reviews, and PRT insurer selection across state insurance supervisors like NYSDFS, SEC Form 10-K Footnote disclosures, and institutional fixed-income dealers like Cantor Fitzgerald and Alpine Woods.
Cycle-comparison tables continue in S&P 500 Margin Dispersion, Hyperscaler Capex & Buyback Flows, Nominal GDP Deceleration & S&P 500 Margins, and Hyperscaler Data-Center Power Bottlenecks; reference S&P 500 Margin Dispersion and institutional datasets for taxonomy standards.
Frequently asked questions
Why cannot an S&P 500 company simply withdraw a $3 billion overfunded pension surplus in cash to buy back stock?
ERISA trust law and Internal Revenue Code Section 4980 impose a punitive 20% to 50% federal excise tax PLUS ordinary 21% corporate income tax on any cash pension reversion upon plan termination—wiping out up to 71% of the surplus!
How did IBM unlock its $3.5B+ overfunded US pension surplus into real corporate Free Cash Flow legally?
Instead of withdrawing cash, IBM halted its external cash 401(k) employer match (~$550M/yr cash outflow!) and replaced it with a 5% "Retirement Benefit Account" pay credit inside its existing overfunded defined-benefit pension trust—letting trust surplus pay employee benefits dollar-for-dollar!
Why does transferring pension obligations in a PRT buyout trigger a large GAAP Net Income LOSS?
Decades of historical actuarial losses sit parked inside Accumulated Other Comprehensive Income (AOCI) on the balance sheet. When an insurer takes over 30% of the plan (ASC 715 settlement), GAAP forces the company to flush 30% of old AOCI losses through the income statement as a non-cash charge!
How does pension LDI immunization affect the 30-Year US Treasury and Long IG corporate bond curves?
As corporate plans cross 100% funded status, LDI glidepaths automatically sell equities and buy 25-to-30-year Treasury STRIPS and Long IG credit—anchoring a price-insensitive structural bid at the ultra-long end of the US yield curve (flattening 10s30s credit spreads)!
Publication record
- Published
- November 12, 2026
- Updated
- November 14, 2026
- Author
- Dr. Marcus Vance, CFA
- Review
- Review not recorded
- Automated fact check
- Passed in the stored pipeline record
- Source URLs
- 3 recorded
AI assistance recorded: anthropic/claude-opus-4.6. This field does not establish human review or source verification.
Academic & Institutional Attribution
Cite This Research & Embed Live Data Card
Standard academic & institutional research paper citation format.
Dr. Marcus Vance, CFA. (2026, November 14). ASC 715 Corporate Pension Surpluses & Pension Risk Transfer (PRT) Buyouts: Industrial EPS Quality. AlphaPulse Finance. https://alphapulsefin.com/analysis/asc-715-corporate-pension-surplus-pension-risk-transfer-epsRelated Institutional Earnings Capex Macro & Institutional Briefings
Explore Institutional Earnings Capex Macro Hub (20) →Institutional Earnings Capex Macro
S&P 500 Margin Dispersion, Hyperscaler Capex & Buyback Flows: Institutional Earnings GuideInstitutional Earnings Capex Macro
Nominal GDP Deceleration & S&P 500 Margins: Decomposing Price/Mix vs Real Unit Volume LeverageInstitutional Earnings Capex Macro
S&P 500 Operating Leverage Dispersion: Cap-Weighted Mega-Cap vs Equal-Weighted EBIT MarginsInstitutional Earnings Capex Macro
Hyperscaler AI GPU Useful-Life Accounting: 4-to-6-Year Server Depreciation Cliffs & EBIT RiskInstitutional Earnings Capex Macro
SEC Rule 10b5-1 Buyback Amendments & Quarterly Earnings Blackout Liquidity WindowsInstitutional Earnings Capex Macro
The S&P 500 Net Interest Expense Paradox: 3.1% Fixed Bonds vs 3.9% T-Bill Cash ShieldsInstitutional Earnings Capex Macro
S&P 500 Free Cash Flow Conversion Audit: Adjusting Operating Cash Flow for SBC & AI CapexInstitutional Earnings Capex Macro
Hyperscaler Data-Center Power Bottlenecks: Grid Interconnection Queues, Nuclear PPAs & HPC LandlordsMarket Insights
Stock futures rise slightly as investors eye AI trade, brace for more data and earnings: Live updatesMonetary Policy
Cook, The Dual Mandate in Rural AmericaMarket Insights
Waller, The Data Version of Godzilla versus Kong: FRED Takes on AIMarket Insights
Corporate America’s profit numbers are just barely beating Wall Street’s expectations
AlphaPulse Finance Data, Benchmarks & Contributor Records
CC BY 4.0 Open Data
Open Institutional Datasets (CSV / JSON) →
Download desk-compiled quantitative series & schemas.
2026 Reference Matrix
2026 Institutional Benchmarks & Thresholds →
Statutory capital, clearing, margin & rate conventions.
Editorial Records
Authors & Review Records →
View named contributors where those records are available.
Complete Index
Master Research & Dossier Archive →
Browse all published briefings by topic pillar & date.