
Institutional Earnings Capex Macro
Nominal GDP Deceleration & S&P 500 Margins: Decomposing Price/Mix vs Real Unit Volume Leverage
Corporations pay wages, leases, and bond coupons out of nominal dollars rather than real GDP; as Core PCE inflation cools toward 2.4%, S&P 500 EBIT margin expansion pivots from pure sticker-price hikes to real unit-volume operating leverage.
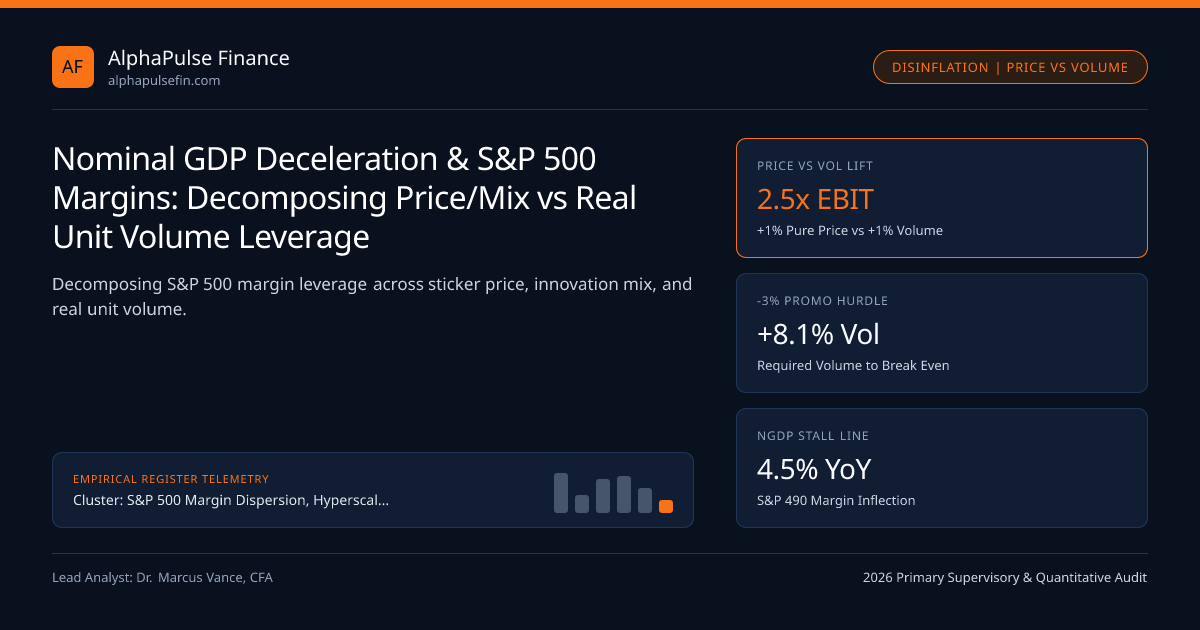
Macro strategists fixated solely on Real GDP (+2.3% YoY) frequently miss why corporate profit margins surged effortlessly across 2021–2023 and then splintered across 2025–2026: S&P 500 revenues track Nominal GDP (Real Output + Inflation), not Real GDP! When nominal US + global GDP ran at 8.5% to 10.2% during peak inflation, mediocre companies hiked list prices +8% on -1% unit volumes and posted record margins because 100% of pure sticker-price hikes above input costs drop straight to EBIT. With BEA Core PCE disinflating toward 2.4% alongside Sticky BLS CPI Shelter, Nominal GDP near ~4.7% exposes companies lacking genuine Real Unit Volume growth.
Why +1% Price/Mix Carries 3.1x the EBIT Margin Impact of +1% Unit Volume#
Not all organic revenue growth dollars are created equal inside a corporate income statement! Consider an industrial or consumer packaged goods manufacturer generating $1,000M Revenue, $600M Variable COGS (60%), $250M Fixed SG&A/Depreciation, and $150M EBIT (15.0% margin):
- Case A — +5.0% Pure Sticker Price Increase (0% Unit Volume Change): Revenue rises +$50M to $1,050M. Because zero extra physical units were manufactured or shipped, Variable COGS stays $600M! All $50M flows directly to EBIT ($150M -> $200M, a +33.3% EBIT explosion and +405 bps margin jump to 19.05%!).
- Case B — +5.0% Real Unit Volume Increase (0% Price Change): Revenue also rises +$50M to $1,050M, but shipping 5% more boxes incurs +5% Variable COGS (+$30M raw materials & freight). Only the $20M contribution margin (40% gross margin) hits EBIT ($150M -> $170M, +13.3% EBIT growth)!
That arithmetic asymmetry (+1% pure price delivers ~2.5x to 3.5x the EBIT lift of +1% unit volume) explains both why 2022 "greedflation" narratives misread basic microeconomics and why disinflation is treacherous when consumer price elasticity snaps back!
The Post-Inflation Volume Hangover in Consumer Staples, Restaurants & Autos#
Between 2021 and 2024, salty-snack, beverage, fast-food QSR, and automotive OEMs pushed cumulative +26% to +34% list-price increases while tolerating -1% to -3% annual unit-volume erosion. By 2025–2026, lower-and-middle-income households hit cumulative price walls—trading down to private-label store brands (Costco Kirkland, Walmart Bettergoods, Aldi).
Forced to fund promotional couponing and value-meal rollbacks (-2% net Price/Mix) while factory labor wages remained permanently sticky (+3.8%/yr), brands without innovation volume suffered reverse price leverage—compressing EBIT margins -220 bps even during positive Real GDP expansion!
- RequiredVolumeToOffsetPriceCut = -PriceCutPct / (GrossContributionMarginPct + PriceCutPct)
- Worked Promotional Price-Cut Trap on a Branded Food Maker (40% Gross Margin, Cutting Price -3.0% to Regain Traffic):
- Required Unit Volume Surge JUST to Hold Gross Profit Dollars Flat = -(-0.03) / (0.40 - 0.03) = 0.03 / 0.37 = +8.11% Unit Volume Required!
- If consumer elasticity is -1.5x (Volume rises only +4.5%), Gross Profit still drops -$13.3M per $1B sales and EBIT falls -8.9%!
The Corporate Pricing Power Wedge (PPI Final Demand Minus Average Hourly Earnings)#
Top-down macro equity models forecast S&P 490 operating margin inflection six months ahead of bottom-up analyst consensus by tracking the Pricing Power Wedge: the YoY growth spread between corporate output prices (BEA GDP Deflator / BLS PPI Finished Goods & Services) and corporate unit labor + input costs (BLS Employment Cost Index / Unit Labor Costs).
Historically across 1970–2026, whenever Nominal US GDP decelerates below 4.5% YoY while Unit Labor Costs grow faster than the GDP Deflator (negative pricing-power wedge), median S&P 500 ex-Tech EBIT margins contract by -85 to -160 bps over the ensuing four quarters, prompting FOMC policy recalibration.
Separating "Price" From "Product Mix" in 10-Q Organic Growth Disclosures#
Read MD&A organic-growth tables in SEC Form 10-Q filings with surgical care: companies routinely combine "Price/Mix: +3.5%" into one blended column! Pure Sticker Price (charging $5.50 instead of $5.00 for the identical box of cereal) hits consumer elasticity walls, whereas Positive Product Mix (customers voluntarily upgrading from a $40k standard server to a $120k AI server, or from economy cabin to premium economy) reflects genuine innovation value capture that compounds sustainably inside a 2% inflation world!
| Macro Inflation Regime | Nominal GDP Range | Dominant S&P Sales Driver | Macro Leading Indicator | Outperforming Equity Factor |
|---|---|---|---|---|
Reflation Boom (2021–2022) | 8.5% - 10.5% | Broad Sticker Price (+7% Price) | BLS CPI / PPI Surge | Cyclical Commodities, Autos & Value |
Goldilocks Disinflation (2024–2026) | 4.6% - 5.6% | AI Mix + Productivity (ULC < PCE) | BEA Core PCE -> 2.4% | Secular Unit-Volume Growth & Club Retail |
Margin Squeeze Stall (NGDP < 4.2%) | 2.5% - 4.2% | Promo Rollbacks (Price < Wages) | GDP Deflator - ULC < -0.5% | High-Gross-Margin SaaS & Regulated Utilities |
Deflationary Recession (NGDP < 1%) | < 1.0% | Simultaneous Price & Volume Drop | ISM New Orders < 45 | Long Sovereign Duration (10Y/30Y UST) |
Disinflation Regime Winner vs Loser Screening Matrix#
Institutional equity strategists and fundamental pod analysts executing across Ally Invest, Atomic Capital, and Alpine Woods screen 10-Q organic volume-vs-price tables against BEA national income accounts (NIPA Corporate Profits Table 1.12).
Historical calibration series link S&P 500 Operating Leverage Dispersion, IRC Section 4501 1% Buyback Excise, and S&P 500 Margin Dispersion, Hyperscaler Capex & Buyback Flows directly to S&P 500 Margin Dispersion and verification registry.
Frequently asked questions
Why do S&P 500 revenues correlate with Nominal GDP (R^2 ~ 0.78) rather than Real GDP?
Corporate financial statements are never inflation-adjusted! Revenues, COGS, debt service, and EPS are booked in current nominal dollars—so a drop from 9% Nominal GDP to 4.7% Nominal GDP cuts baseline S&P top-line tailwinds in half even if Real GDP stays steady at 2.3%!
Why is cutting sticker prices by -3% almost always margin-destructive for mature Consumer Staples brands?
Because packaged-food price elasticity averages only -0.8x to -1.3x! Using -Price_Cut / (Gross_Margin + Price_Cut), a -3% price cut on a 40%-margin brand requires +8.1% more volume (-2.7x elasticity!) just to break even on gross profit dollars!
How does US labor productivity growth (+2.1% YoY) protect S&P 500 margins even when hourly wages grow +3.9%?
Corporations pay Unit Labor Costs (Hourly Compensation Growth minus Output Per Hour Productivity), not raw hourly wages! When AI/automation lifts output per hour by +2.1%, +3.9% wage growth translates to only +1.8% Unit Labor Cost inflation—below 2.4% output price inflation!
How do BEA NIPA Corporate Profits (Table 1.12) differ from Wall Street S&P 500 GAAP/Non-GAAP EPS?
NIPA Profits from Current Production cover ALL US private and public corporations derived from IRS tax-return concepts (excluding capital gains, inventory valuation IVA, and bad-debt write-offs), acting as an unmanipulated macro truth check whenever Non-GAAP S&P EPS diverges upward!
Publication record
- Published
- November 12, 2026
- Updated
- November 14, 2026
- Author
- Dr. Marcus Vance, CFA
- Review
- Review not recorded
- Automated fact check
- Passed in the stored pipeline record
- Source URLs
- 3 recorded
AI assistance recorded: anthropic/claude-opus-4.6. This field does not establish human review or source verification.
Academic & Institutional Attribution
Cite This Research & Embed Live Data Card
Standard academic & institutional research paper citation format.
Dr. Marcus Vance, CFA. (2026, November 14). Nominal GDP Deceleration & S&P 500 Margins: Decomposing Price/Mix vs Real Unit Volume Leverage. AlphaPulse Finance. https://alphapulsefin.com/analysis/nominal-gdp-deceleration-sp500-price-mix-vs-unit-volume-marginsRelated Institutional Earnings Capex Macro & Institutional Briefings
Explore Institutional Earnings Capex Macro Hub (20) →Institutional Earnings Capex Macro
S&P 500 Margin Dispersion, Hyperscaler Capex & Buyback Flows: Institutional Earnings GuideInstitutional Earnings Capex Macro
S&P 500 Operating Leverage Dispersion: Cap-Weighted Mega-Cap vs Equal-Weighted EBIT MarginsInstitutional Earnings Capex Macro
Hyperscaler AI GPU Useful-Life Accounting: 4-to-6-Year Server Depreciation Cliffs & EBIT RiskInstitutional Earnings Capex Macro
SEC Rule 10b5-1 Buyback Amendments & Quarterly Earnings Blackout Liquidity WindowsInstitutional Earnings Capex Macro
The S&P 500 Net Interest Expense Paradox: 3.1% Fixed Bonds vs 3.9% T-Bill Cash ShieldsInstitutional Earnings Capex Macro
S&P 500 Free Cash Flow Conversion Audit: Adjusting Operating Cash Flow for SBC & AI CapexInstitutional Earnings Capex Macro
Hyperscaler Data-Center Power Bottlenecks: Grid Interconnection Queues, Nuclear PPAs & HPC LandlordsInstitutional Earnings Capex Macro
IRC Section 4501 1% Buyback Excise Tax & Accelerated Share Repurchase (ASR) Dealer CollarsMonetary Policy
Cook, The Dual Mandate in Rural AmericaMarket Insights
Waller, The Data Version of Godzilla versus Kong: FRED Takes on AIMarket Insights
Corporate America’s profit numbers are just barely beating Wall Street’s expectationsMonetary Policy
Faisal Islam: How high will interest rates go?
AlphaPulse Finance Data, Benchmarks & Contributor Records
CC BY 4.0 Open Data
Open Institutional Datasets (CSV / JSON) →
Download desk-compiled quantitative series & schemas.
2026 Reference Matrix
2026 Institutional Benchmarks & Thresholds →
Statutory capital, clearing, margin & rate conventions.
Editorial Records
Authors & Review Records →
View named contributors where those records are available.
Complete Index
Master Research & Dossier Archive →
Browse all published briefings by topic pillar & date.