
Institutional Earnings Capex Macro
DXY Dollar Strength & S&P 500 Foreign Revenue: FX Translation vs ASC 815 Cash-Flow Hedging
With 41% of S&P 500 revenue and 59% of Information Technology sales generated outside the United States, a 10% trade-weighted dollar move mechanically shifts index EPS by 1.8% to 2.2% across capital markets.
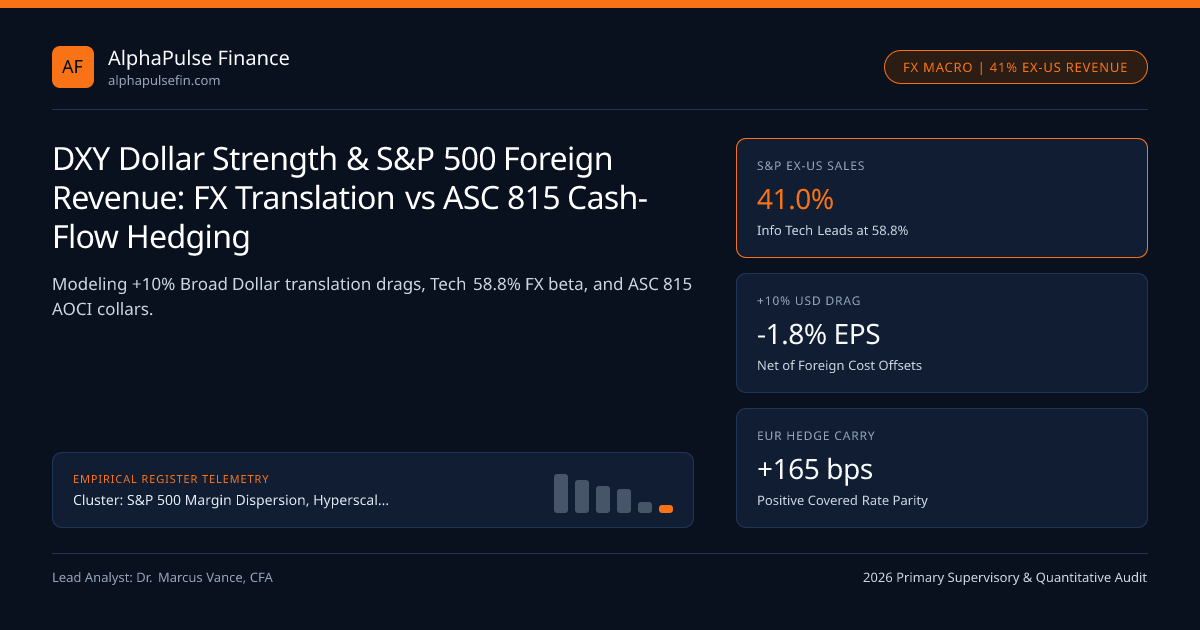
Currency volatility transmits global central-bank divergence directly into US equity income statements because 41.0% of aggregate S&P 500 revenue—and 58.8% of S&P 500 Information Technology revenue—originates outside the United States. Whenever wide rate differentials between the FOMC 3.75%–4.00% Target Corridor and European or Asian peers drive a +10% appreciation in the Federal Reserve Broad Trade-Weighted Dollar Index, unhedged foreign euro, yen, and sterling revenues translate into fewer US dollars—mechanically shaving -1.8% to -2.2% off aggregate S&P 500 EPS despite corporate treasury ASC 815 derivative hedging programs.
Geographic Revenue Exposure Across S&P 500 Sectors: Why Tech & Materials Lead FX Beta#
Investors often misperceive domestic defensive sectors and global mega-caps as sharing uniform currency risk. Geographic segment disclosures compiled from SEC Form 10-K ASC 280 footnotes reveal stark sector bifurcation:
- High Foreign-Revenue Sectors (Strong Dollar Losers): Information Technology (58.8% ex-US sales), Materials (53.4%), Communication Services (44.2%), Consumer Staples multinationals (42.5%), and Industrials (39.0%).
- Domestic-Insulated Sectors (Strong Dollar Shelters): Utilities (1.8% ex-US sales), Real Estate REITs (6.4%), Domestic Healthcare Providers (9.2%), and Regional Financials (12.5%).
Consequently, a sharp DXY breakout triggered by US Treasury 2s10s curve repricing systematically favors domestic mid-cap utilities and financials over unhedged global software and semiconductor exporters.
Accounting Translation vs Economic Transaction Exposure Under ASC 830#
Corporate FX sensitivity operates through two distinct channels under FASB ASC 830 (Foreign Currency Matters) that equity analysts frequently conflate:
- Accounting Translation Exposure (Unhedged Income Statement Optics): When Microsoft or Netflix bills a German enterprise EUR 100 million via a Dublin subsidiary that incurs local euro payroll, both revenue and local costs shrink proportionally when EUR/USD falls -10%. Corporate treasurers almost never spend cash option premium to hedge pure translation, preferring to guide Wall Street toward "Constant-Currency Revenue Growth" Non-GAAP metrics!
- Economic Transaction Exposure (Real Cash Margin Squeeze!): When Apple manufactures iPhones priced in USD-linked components in Asia and sells them in Japan in JPY, a weaker yen crushes gross cash margins unless Apple either hikes Japanese retail sticker prices (hurting unit volume) or settles in-the-money JPY put options.
- Worked +10% Broad USD Appreciation on a Global Software Mega-Cap (58% Ex-US Sales, 24% Ex-US Costs, 50% Hedged Yr-1):
- Unhedged Gross Revenue Translation Drag = 58% * (-10%) = -5.80% Top-Line USD Drag
- Natural Local Foreign Payroll/Opex Offset (Cost Ratio 65% * 24% Foreign) = +1.56% Cost Savings
- Net Unhedged Operating Hit (-4.24%) cushioned 50% in Year 1 by ASC 815 Collars = -2.12% Year-1 EPS Hit (-4.24% in Year 2!)
ASC 815 Cash-Flow Layer Hedging & Why Forward Points Favor EUR Hedges Over JPY#
How do Fortune 500 treasury desks hedge economic transaction exposure without blowing up GAAP earnings volatility? Under ASC 815 Hedge Accounting, treasurers execute rolling 4-to-8-quarter layered FX forwards and zero-cost risk-reversal collars (e.g., hedging 80% of Q+1 forecast cash flows, 60% of Q+2, 40% of Q+3, and 20% of Q+4), parking unrealized mark-to-market derivative gains inside Accumulated Other Comprehensive Income (AOCI) until the underlying foreign sale hits revenue.
Crucially, FX forward pricing follows Covered Interest Parity (Forward Rate = Spot * (1 + rUSD) / (1 + rForeign)). Because US short rates (~3.90%) sit above ECB euro deposit rates (~2.25%) and BoJ yen rates (~0.50%), selling foreign currency forward against USD earns positive annualized carry (+165 bps on EUR/USD; +340 bps on USD/JPY)—paying US multinationals to hedge foreign receivables! However, layered hedges only delay a permanent dollar shift by 9 to 15 months; once old strikes roll off, full spot FX hits EBIT.
Natural Operational Cost Offsets: Why 41% Foreign Sales Only Cuts EPS by -1.8% (Not -4.1%)#
Naive macro top-down math multiplies 41% foreign revenue by a +10% USD rally to predict a -4.1% S&P 500 revenue and EPS hit. Empirically, S&P 500 EPS drops by less than half that amount (-1.8% to -2.2%) due to natural overseas COGS and SG&A cost offsets: roughly 60% of foreign-subsidiary expenses (European engineers, Latin American bottling plants, Asian logistics) are denominated in the same weakening local currencies, while USD-denominated imported inputs become cheaper for US domestic retailers.
| FX Exposure Dimension | GAAP Accounting Standard | Treasury Hedge / Execution Rail | Carry / Margin Mechanics | Analyst Modeling Action |
|---|---|---|---|---|
| Subsidiary Translation | ASC 830 (Current Rate) | Rarely hedged (Constant-FX KPI) | Proportional rev & local cost shift | Compare Constant-FX vs GAAP growth |
| Forecast Export Sales | ASC 815 (Cash Flow AOCI) | Layered forwards via Airwallex / Bosonic | +165 to +340 bps positive USD carry | Read 10-Q AOCI derivative roll-off |
| Balance Sheet AR / AP | ASC 830 (Remeasurement) | 1-month FX swaps (CFTC SDR) | Flows directly through Other Income | Verify zero net FX remeasurement leak |
| Hyperinflationary Subs | ASC 830 (Argentina / Turkey) | Local cash sweep / hard-USD pricing | USD becomes functional currency -> P&L hit | Strip non-cash FX monetary losses |
Institutional Cross-Border FX Treasury & Multi-Currency Execution Matrix#
Corporate treasury teams execute FX forwards, NDFs, and cross-border supplier settlements across CFTC-supervised swap dealers, NFA futures venues, and institutional cross-border treasury platforms including Airwallex, Bosonic, and Cantor Fitzgerald.
Additional stress-test parameters appear in S&P 500 Margin Dispersion, Hyperscaler Capex & Buyback Flows, GAAP vs Non-GAAP S&P 500 EPS Wedge (+14.5%), and Nominal GDP Deceleration & S&P 500 Margins within the S&P 500 Margin Dispersion dossier and analytical tools.
Frequently asked questions
Why should investors look past management’s "Constant-Currency Revenue Growth" metric after 12 months?
Constant-currency growth strips out FX fluctuations using prior-year exchange rates to show underlying unit demand, which is useful for 1-2 quarters—but shareholders cannot pay dividends or buy back USD stock with hypothetical constant-currency euros!
Why does US Information Technology lose more margin from a strong dollar than Consumer Staples with similar foreign sales?
Coca-Cola or Procter & Gamble manufactures locally in Europe/LatAm (local FX costs match local FX revenue), whereas US software/semi firms pay 75%+ of engineering R&D in Silicon Valley USD while collecting euro and yen revenue!
Where on the financial statements can analysts see how much FX hedge protection remains for next year?
Check the "Derivatives and Hedging (ASC 815)" footnote and the Statement of Comprehensive Income: the "Net unrealized gain/loss on cash flow hedges to be reclassified from AOCI into earnings within 12 months" quantifies exact locked-in FX protection!
How does ASC 830 hyperinflation accounting hit US consumer staples companies operating in Argentina or Turkey?
Once cumulative 3-year local inflation exceeds 100%, ASC 830 forces the subsidiary to adopt the US Dollar as its functional currency—routing all local peso/lira devaluation losses straight through GAAP Net Income instead of Equity CTA!
Publication record
- Published
- November 12, 2026
- Updated
- November 14, 2026
- Author
- Dr. Marcus Vance, CFA
- Review
- Review not recorded
- Automated fact check
- Passed in the stored pipeline record
- Source URLs
- 3 recorded
AI assistance recorded: anthropic/claude-opus-4.6. This field does not establish human review or source verification.
Academic & Institutional Attribution
Cite This Research & Embed Live Data Card
Standard academic & institutional research paper citation format.
Dr. Marcus Vance, CFA. (2026, November 14). DXY Dollar Strength & S&P 500 Foreign Revenue: FX Translation vs ASC 815 Cash-Flow Hedging. AlphaPulse Finance. https://alphapulsefin.com/analysis/dxy-dollar-strength-sp500-foreign-revenue-fx-hedging-epsRelated Institutional Earnings Capex Macro & Institutional Briefings
Explore Institutional Earnings Capex Macro Hub (20) →Institutional Earnings Capex Macro
S&P 500 Margin Dispersion, Hyperscaler Capex & Buyback Flows: Institutional Earnings GuideInstitutional Earnings Capex Macro
GAAP vs Non-GAAP S&P 500 EPS Wedge (+14.5%): SEC Regulation G & Item 10(e) EnforcementInstitutional Earnings Capex Macro
Hyperscaler Incremental AI ROIC vs WACC: The $600B Cloud & Enterprise Monetization HurdleInstitutional Earnings Capex Macro
Implied S&P 500 Equity Risk Premium: Cash-Payout FCF Yield vs 10-Year TIPS Real YieldsInstitutional Earnings Capex Macro
Debt-Funded M&A Accretion Hurdle Rates vs Share Buyback IRR: Exposing the EPS Accretion FallacyInstitutional Earnings Capex Macro
Earnings-Day Single-Stock Implied Straddles & S&P 500 Dispersion Volatility MechanicsInstitutional Earnings Capex Macro
ASC 715 Corporate Pension Surpluses & Pension Risk Transfer (PRT) Buyouts: Industrial EPS QualityInstitutional Earnings Capex Macro
Nominal GDP Deceleration & S&P 500 Margins: Decomposing Price/Mix vs Real Unit Volume LeverageMarket Insights
The Nvidia Affair Is Terrible Timing for Corporate AmericaMarket Insights
Stock Market Today: Yields Jump as Inflation Comes in Hotter Than ExpectedRegulatory Compliance
Federal Reserve Board announces approval of two applications by Mutual Federal Bancorp, MHC, and MFB Bancorp, Inc.Market Insights
China wholesale inflation hits highest in more than four years as consumer measure slows
AlphaPulse Finance Data, Benchmarks & Contributor Records
CC BY 4.0 Open Data
Open Institutional Datasets (CSV / JSON) →
Download desk-compiled quantitative series & schemas.
2026 Reference Matrix
2026 Institutional Benchmarks & Thresholds →
Statutory capital, clearing, margin & rate conventions.
Editorial Records
Authors & Review Records →
View named contributors where those records are available.
Complete Index
Master Research & Dossier Archive →
Browse all published briefings by topic pillar & date.