
Inflation Breakevens Real Rates
Core PCE Imputed Financial Services & Portfolio Management Fees: S&P 500 Equity Beta in Inflation
Representing ~4.6% of BEA Core PCE (and 0% of BLS CPI!), Portfolio Management Fees and FISIM imputed bank deposit services mechanically transmit S&P 500 equity rallies directly into hotter FOMC Supercore inflation prints.
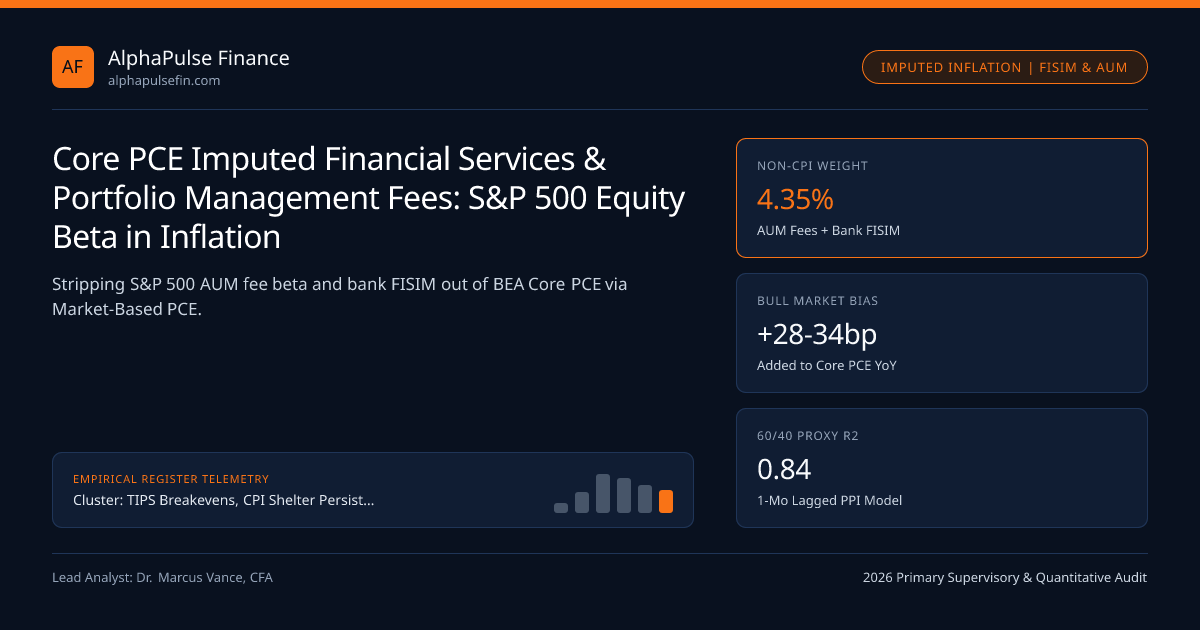
Imagine the S&P 500 rallies +22% over twelve months while registered investment advisors (RIAs) and asset managers regulated by the SEC leave their 0.75% percentage-of-AUM management fee rate completely unchanged. Did economy-wide inflation just surge? According to BLS CPI, the answer is no (CPI excludes investment advisory fees completely!). According to BEA Core PCE under the CORE-PCE 2026 Benchmark—and even more alarmingly, inside FOMC "Supercore" Services Ex-Housing—a +22% stock market rally mechanically inflates Portfolio Management & Investment Advice (~1.65% of Core PCE) by ~+18% YoY, adding +28 to +34 bps directly to Year-over-Year Core PCE!
How BLS PPI Measures Portfolio Management Revenue Per Account (The S&P 500 Loop!)#
Trace the bizarre statistical feedback loop linking equity index prices to FOMC Corridor policy deliberations:
- Why BEA Includes "Services Furnished Without Payment by Financial Intermediaries" (~4.6% of Core PCE!): National Income and Product Accounts (GDP) measure all household consumption of financial services—both Explicit AUM/Brokerage Fees (~1.9% of Core PCE) across institutional and retail platforms like Ally Invest and Alpine Woods, and Imputed Bank Deposit Services (FISIM, ~2.7% of Core PCE).
- The PPI Asset-Value Deflator Quirk: BEA pulls its price index for Portfolio Management directly from BLS PPI Series PCU523940523940. How does BLS price an advisory fee of 0.75% * Client_AUM? Holding client transaction volume ("real output units") roughly fixed, when the S&P 500 jumps +10% in Quarter 1, the dollar fee revenue collected per account jumps +10%—which PPI records as a +10% "price increase" (typically with a 1-month billing-cycle lag)!
- Perverse Monetary Policy Reflexivity: When the FOMC signals dovish rate cuts, stocks rally +12% -> raising PPI Portfolio Management fees -> artificially boosting Supercore PCE by +35 to +50 bps annualized -> making FOMC inflation look sticky purely because stocks went up!
FISIM: Financial Intermediation Services Indirectly Measured (Bank Deposit Spreads)#
Even harder to observe in the market is the other half of PCE Financial Services: Imputed Services of Commercial Banks (FISIM, ~2.7% of Core PCE)! Because checking accounts rarely charge a $25 monthly ticket price—instead paying 0.15% deposit interest while banks invest at the 3.88% Reference Rate (Treasuries / EFFR) supervised by the Federal Reserve and FDIC—BEA imputes that 373-bps interest spread (Reference Rate minus Deposit Rate) as the "implicit price" depositors pay for free checking and wire services!
- CorePCEImputationWedge = CorePCEHeadlineYoY - MarketBasedCorePCEYoY
- Worked Equity Bull-Market Distortion on FOMC Supercore PCE:
- Lagged 12-Month 60/40 Portfolio Return = (0.60 * +22.0%) + (0.40 * +4.5%) = +15.0% AUM expansion
- PPI Portfolio Management rises +14.2% YoY * 1.65% Core PCE Weight = +23.4 bps added to Core PCE (+46 bps to Supercore!)
- Add +6.0 bps from Bank FISIM Spread -> Standard Core PCE prints 2.89% while Market-Based Core PCE is already at 2.60%!
Market-Based Core PCE: Why the FOMC Strips Out Imputed Financial Noise!#
Recognizing how dangerous it would be to hike interest rates just because the S&P 500 rallied or imputed FISIM spreads jumped, BEA publishes an official companion index watched hawkishly by Fed Chair briefings: Market-Based Core PCE (excluding imputed non-market prices like FISIM and portfolio fee imputations!).
Headline Core PCE vs Market-Based Core PCE Attribution Matrix (Q4 2026)#
Notice the +28 to +42 bps divergence between standard Core PCE (3.40% stress benchmark) and Market-Based Core PCE during strong equity bull markets!
| Financial Service Line | Core CPI Weight | Standard Core PCE Wt. | Market-Based Core PCE | Underlying Price Driver |
|---|---|---|---|---|
| Portfolio Mgmt & Inv. Advice | 0.00% (Excluded) | 1.65% | 0.00% (Excluded!) | 60/40 Equity & Bond Market NAV (1M Lag) |
Imputed Bank Deposit (FISIM) | 0.00% (Excluded) | 2.70% | 0.00% (Excluded!) | UST Reference Yield minus Checking Rate |
| Explicit Bank/ATM/Card Fees | 0.18% | 0.62% | 0.71% (Included) | Actual wire, overdraft & account fees |
| Net Life & P/C Insurance | 3.22% (Gross) | 3.15% (Net/Imputed) | 1.45% (Observable) | Premiums minus actuarial claims (SEC 10-K) |
Forecasting Next Month’s PPI Portfolio Management Print From Lagged S&P 500 + Agg#
Because RIA advisory contracts bill either on Quarter-End / Prior-Month Closing AUM (60% equity / 40% bond blend), quantitative macro desks predict Wednesday's PPI Portfolio Management line (released before PCE!) with 0.84 correlation using 0.60 * LaggedSP500Return + 0.40 * LaggedUSAggBondReturn—gaining a decisive edge on month-end Supercore PCE consensus!
Upstream pillar coverage resides in TIPS Breakevens, CPI Shelter Persistence & Forward Real Rates, complemented by 30-Year TIPS Real Yield Auctions, TIPS Asset-Swap & Iota Spreads, TIPS Breakevens, and regulatory bodies.
Frequently asked questions
Why does BEA classify Portfolio Management as a "non-market / imputed" exclusion in Market-Based Core PCE?
Because portfolio management fees are deducted automatically out of fluctuating fund/account Net Asset Values rather than posted as an observable unit price per discrete transaction, BEA strips them out of Market-Based PCE!
Does an S&P 500 stock market crash immediately lower Core PCE inflation?
Yes—with a 1-to-2-month billing lag! A -15% quarterly equity correction pulls PPI Portfolio Management down ~-9% to -11%, shaving ~15-18 bps off YoY Core PCE and ~32 bps off Supercore Services Ex-Housing!
What happened toFISIM imputed bank inflation when the Fed raised EFFR to 5.33% while banks kept checking rates at 0.10%?
The spread between the risk-free reference rate and near-zero checking deposit rates widened dramatically, pushing BEA’s imputed "price of depositor services" sharply higher even though customers paid zero extra cash fees!
Do TIPS bondholders get paid extra principal when S&P 500 rallies inflate PCE Portfolio Management fees?
No! TIPS index strictly to BLS NSA CPI-U—which assigns 0.00% weight to portfolio management fees and FISIM. This is a pure FOMC-policy-reaction quirk, not a TIPS accrual driver.
Publication record
- Published
- November 13, 2026
- Updated
- November 14, 2026
- Author
- Dr. Marcus Vance, CFA
- Review
- Review not recorded
- Automated fact check
- Passed in the stored pipeline record
- Source URLs
- 3 recorded
AI assistance recorded: anthropic/claude-opus-4.6. This field does not establish human review or source verification.
Academic & Institutional Attribution
Cite This Research & Embed Live Data Card
Standard academic & institutional research paper citation format.
Dr. Marcus Vance, CFA. (2026, November 14). Core PCE Imputed Financial Services & Portfolio Management Fees: S&P 500 Equity Beta in Inflation. AlphaPulse Finance. https://alphapulsefin.com/analysis/core-pce-portfolio-management-financial-services-equity-betaRelated Inflation Breakevens Real Rates & Institutional Briefings
Explore Inflation Breakevens Real Rates Hub (20) →Inflation Breakevens Real Rates
TIPS Breakevens, CPI Shelter Persistence & Forward Real Rates: Institutional GuideInflation Breakevens Real Rates
30-Year TIPS Real Yield Auctions: February/August Supply Liquidity & Real-Annuity LDI DemandInflation Breakevens Real Rates
BLS CPI Health Insurance Retained-Earnings Method: October Resets vs BEA PPI Medical CareInflation Breakevens Real Rates
Import Tariff Pass-Through Into Core Goods: Price-Level Step Jumps & 2s10s Breakeven InversionInflation Breakevens Real Rates
Zero-Coupon vs Year-on-Year Inflation Caps & Floors: Tail Volatility Smiles & Regime ProbabilitiesInflation Breakevens Real Rates
Employment Cost Index (ECI) vs Average Hourly Earnings & Atlanta Fed Wage TrackerInflation Breakevens Real Rates
Gold Spot Divergence From 10-Year TIPS Real Yields: EM Central Bank Reserve ReallocationInflation Breakevens Real Rates
TIPS Asset-Swap & Iota Spreads: Cash Breakeven vs Zero-Coupon Inflation Swap ArbitrageInstitutional Earnings Capex Macro
Corporate Cash Conversion Cycle (DSO, DIO, DPO): Working Capital Forensics & ASC 405-50 DebtInstitutional Earnings Capex Macro
DXY Dollar Strength & S&P 500 Foreign Revenue: FX Translation vs ASC 815 Cash-Flow HedgingInstitutional Earnings Capex Macro
GAAP vs Non-GAAP S&P 500 EPS Wedge (+14.5%): SEC Regulation G & Item 10(e) EnforcementInstitutional Earnings Capex Macro
Hyperscaler Incremental AI ROIC vs WACC: The $600B Cloud & Enterprise Monetization Hurdle
AlphaPulse Finance Data, Benchmarks & Contributor Records
CC BY 4.0 Open Data
Open Institutional Datasets (CSV / JSON) →
Download desk-compiled quantitative series & schemas.
2026 Reference Matrix
2026 Institutional Benchmarks & Thresholds →
Statutory capital, clearing, margin & rate conventions.
Editorial Records
Authors & Review Records →
View named contributors where those records are available.
Complete Index
Master Research & Dossier Archive →
Browse all published briefings by topic pillar & date.