
Inflation Breakevens Real Rates
30-Year TIPS Real Yield Auctions: February/August Supply Liquidity & Real-Annuity LDI Demand
Auctioned only twice per year (February new issue and August reopening), 30-year US TIPS clearing near 2.24% real yield carry +24.5 years of real modified duration and require pre-auction dealer concessions against thin COLA pension demand.
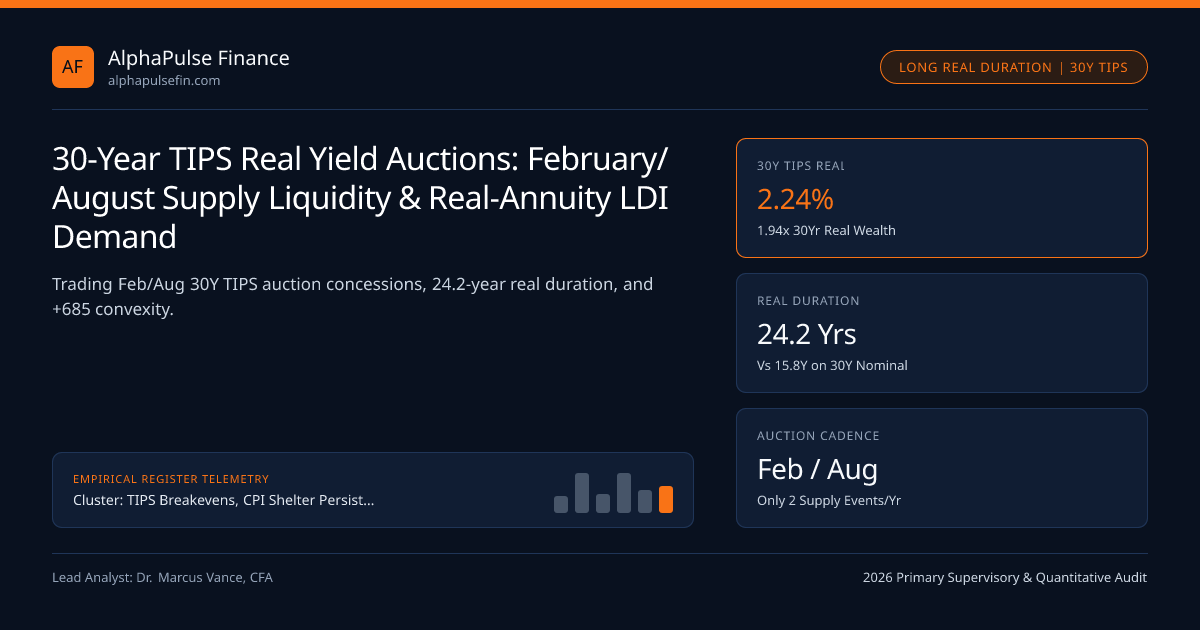
Compare the UK Gilt market—where inflation-linked Gilts ("Linkers") exceed 30% of the entire UK national debt to match mandatory Cost-of-Living-Adjusted (COLA) corporate pensions—against the United States, where most private ERISA pensions pay nominal fixed benefits and 30-Year US TIPS are auctioned only TWICE a year (one $9B February new issue and one $8B August reopening)! Clearing near 2.24% real yield (+26 bps steeper than 10-Year TIPS (1.98%) against 30-Year Nominal Bonds (4.61%)), a single $9B February 30-year TIPS auction dumps as much real DV01 onto Primary Dealer Balance Sheets as $26 billion of 10-year notes!
Why Only Two Auctions Per Year Create Systematic Feb/Aug Supply Concessions#
Under the Treasury Borrowing Advisory Committee (TBAC) TIPS calendar, 5-year TIPS auction four times annually (Apr/Jun/Oct/Dec) and 10-year TIPS auction six times annually (Jan/Mar/May/Jul/Sep/Nov)—but 30-Year TIPS hit the market ONLY on the third Thursday of February (New Issue) and August (Single Reopening)!
Look at the extreme duration math confronting primary dealers like Cantor Fitzgerald:
- Because 30-year TIPS carry a low real coupon (2.125% or 2.250%) compared to a 4.625% nominal 30-year coupon, 30-Year TIPS Modified Real Duration sits near 22.8 to 24.6 years (compared to just ~15.8 years on a 30-Year Nominal Treasury!)—and Real Convexity exceeds +680!
- Consequently, across 2014-2026 event studies, 10s30s real TIPS curves systematically bear-steepen by +4.5 to +8.0 bps during the 10 trading sessions leading into the 1:00 PM ET February/August auction, before mean-reverting -5.5 bps flatter over the subsequent 15 sessions once supply clears!
Why US Corporate Pensions Buy Nominal 30Y Bonds While Endowments & Public Plans Buy 30Y TIPS#
Why does the 30-year US breakeven (4.61% Nominal minus 2.24% Real = 237 bps) often trade tighter or flat to 10-year Zero-Coupon Swaps despite 30 years of fiscal uncertainty?
Unlike the UK (where statutory RPI/CPI pension indexation forced UK LDI funds to bid 30-year Linker real yields down to -2.50%!), US private-sector corporate defined-benefit plans governed by ERISA/PBGC pay unindexed nominal annuities—so US corporate LDI buys 30-year IG corporates and Nominal STRIPs! Natural long-end 30-year US TIPS demand comes instead from a narrower institutional triad:
- University Endowments & Foundations targeting CPI + 5.0% real spending rules;
- State/Municipal Public Pensions (CalPERS / Teachers) hedging partial 2% COLA liabilities; and
- Sovereign Wealth Funds & Multi-Asset Risk-Parity Funds locking in a guaranteed +2.24% 30-year real compound return (+94.4% cumulative real purchasing-power growth over 30 years!) across platforms and custodians reviewed via SEC and FINRA TRACE.
- BetaAdjusted30YBreakevenHedgeRatio = (DV0130YTIPS * EmpiricalRealtoNomBeta) / DV0130Y_Nominal
- Worked 30-Year Cash Breakeven DV01 Sizing ($100M Long Feb-2056 30Y TIPS @ 24.20 Real Dur = $242,000/bp Real DV01):
- Warning: If you short $242,000/bp of 30Y Nominals ($153.2M par @ 15.80 Dur), and Nominal Yields jump +20bp (10bp Real + 10bp BEI):
- Real TIPS loses 10bp * $242K = -$2.42M, while Short Nominal GAINS 20bp * $242K = +$4.84M (Over-hedged to Nominals!)
- Exact Cash Breakeven Match: Match EQUAL $242,000/bp DV01 ONLY to isolate pure BEI = yNom - yReal!
Real vs Nominal 30-Year Macauley Duration & Convexity Advantage Equations#
Notice the +8.4-year Duration Gap between a 30-year TIPS (24.2 yrs) and a 30-year Nominal Bond (15.8 yrs)! Never construct a 1-for-1 par-weighted 30-year cash breakeven ($100M TIPS vs $100M Nominal)—unless you weight by empirical beta or DV01!

5Y vs 10Y vs 30Y US TIPS Auction Microstructure & Investor Base Matrix#
Primary dealer awards on 30-year TIPS auctions average just 7% to 11% when real yields exceed 2.15%, compared with >19% during the 2021 negative-real-yield regime.
| US TIPS Benchmark Tenor | Auction Schedule | Typical Size | Real Mod. Duration | Primary Institutional Buyer |
|---|---|---|---|---|
| 5-Year US TIPS | Apr, Jun(R), Oct, Dec(R) | $21B - $24B | 4.65 Years | TIPS ETFs, Macro Breakeven Pods, Banks |
| 10-Year US TIPS | Jan, Mar(R), May(R), Jul, Sep(R), Nov(R) | $17B - $20B | 8.92 Years | Global Central Banks, Risk-Parity, Core Funds |
| 30-Year US TIPS | Feb (New), Aug (Reopen) ONLY | $8B - $9B | 24.20 Years | Endowments, State COLA Plans, Sovereign Wealth |
| 30-Year TIPS Principal STRIP | Secondary Dealer Stripping | Bespoke OTC | 29.85 Years! | Ultra-Convex Tail & COLA Immunization (FINRA) |
Exploiting Massive +680 Real Convexity in 10s30s Real Flattener Boxes#
Because a 2.24% 30-year TIPS possesses +685 convexity versus +92 convexity on a 10-year TIPS (requiring ~2.75x par of 10Y TIPS to match 1.00x par of 30Y TIPS real DV01!), a DV01-neutral 10s30s Real Curve Flattener (Long $100M 30Y TIPS / Short $275M 10Y TIPS) entered on February/August auction afternoon enjoys +432 net positive convexity: making money if real rates plunge -100 bps in a recession AND losing less than linear DV01 if real rates surge +100 bps!
Quantitative pods link this specification with BLS CPI Health Insurance Retained-Earnings Method, University of Michigan vs NY Fed SCE Inflation Expectations, and TIPS Breakevens, CPI Shelter Persistence & Forward Real Rates; browse TIPS Breakevens or tracked macro entities for live benchmarks.
Frequently asked questions
Why did the US Treasury suspend 30-year TIPS auctions between 2002 and 2009 before bringing them back in 2010?
Budget surpluses in 2000-2001 and wide +90-bps early TIPS illiquidity discounts prompted Treasury to pause 30Y TIPS in 2002; post-2008 deficits and TBAC debt-diversification mandates relaunched annual Feb/Aug 30Y TIPS in 2010.
Why does a 30-year TIPS price swing MORE violently than a 30-year Nominal Treasury when real yields jump +50 bps?
With 24.2 years of real duration (vs 15.8 years on a 4.625% Nominal 30Y), a +50-bps jump in 30-year real yields knocks -11.3% off a par 30Y TIPS clean price, compared to -7.6% on a 30Y Nominal bond!
How do you weight a pure 30-year TIPS Breakeven trade without unintended directional duration risk?
Match exact dollar DV01 ($100M 30Y TIPS @ 24.2 Dur = $242K/bp paired against $153.2M 30Y Nominal @ 15.8 Dur = $242K/bp) if trading pure Nominal - Real breakeven; scale Nominal down by ~0.65x if empirical real-to-nominal beta hedging!
Did US pension funds suffer anything like the September 2022 UK LDI Gilt Linker crisis?
No! UK DB pensions held massive 4x-7x repo-levered 30Y-50Y Inflation-Linked Gilts (30+ duration) for mandatory RPI COLAs; US corporate DB plans use modest 1.5x-2.0x nominal Treasury/corporate LDI and hit >103% funded status smoothly.
Publication record
- Published
- November 13, 2026
- Updated
- November 14, 2026
- Author
- Dr. Marcus Vance, CFA
- Review
- Review not recorded
- Automated fact check
- Passed in the stored pipeline record
- Source URLs
- 3 recorded
AI assistance recorded: anthropic/claude-opus-4.6. This field does not establish human review or source verification.
Academic & Institutional Attribution
Cite This Research & Embed Live Data Card
Standard academic & institutional research paper citation format.
Dr. Marcus Vance, CFA. (2026, November 14). 30-Year TIPS Real Yield Auctions: February/August Supply Liquidity & Real-Annuity LDI Demand. AlphaPulse Finance. https://alphapulsefin.com/analysis/thirty-year-tips-real-yield-auctions-pension-real-annuity-ldiRelated Inflation Breakevens Real Rates & Institutional Briefings
Explore Inflation Breakevens Real Rates Hub (20) →Inflation Breakevens Real Rates
TIPS Breakevens, CPI Shelter Persistence & Forward Real Rates: Institutional GuideInflation Breakevens Real Rates
BLS CPI Health Insurance Retained-Earnings Method: October Resets vs BEA PPI Medical CareInflation Breakevens Real Rates
Import Tariff Pass-Through Into Core Goods: Price-Level Step Jumps & 2s10s Breakeven InversionInflation Breakevens Real Rates
Zero-Coupon vs Year-on-Year Inflation Caps & Floors: Tail Volatility Smiles & Regime ProbabilitiesInflation Breakevens Real Rates
Employment Cost Index (ECI) vs Average Hourly Earnings & Atlanta Fed Wage TrackerInflation Breakevens Real Rates
Gold Spot Divergence From 10-Year TIPS Real Yields: EM Central Bank Reserve ReallocationInflation Breakevens Real Rates
TIPS Asset-Swap & Iota Spreads: Cash Breakeven vs Zero-Coupon Inflation Swap ArbitrageInflation Breakevens Real Rates
University of Michigan vs NY Fed SCE Inflation Expectations: Partisan Skew & Salience BiasInstitutional Earnings Capex Macro
DXY Dollar Strength & S&P 500 Foreign Revenue: FX Translation vs ASC 815 Cash-Flow HedgingInstitutional Earnings Capex Macro
GAAP vs Non-GAAP S&P 500 EPS Wedge (+14.5%): SEC Regulation G & Item 10(e) EnforcementInstitutional Earnings Capex Macro
Hyperscaler Incremental AI ROIC vs WACC: The $600B Cloud & Enterprise Monetization HurdleInstitutional Earnings Capex Macro
Implied S&P 500 Equity Risk Premium: Cash-Payout FCF Yield vs 10-Year TIPS Real Yields
AlphaPulse Finance Data, Benchmarks & Contributor Records
CC BY 4.0 Open Data
Open Institutional Datasets (CSV / JSON) →
Download desk-compiled quantitative series & schemas.
2026 Reference Matrix
2026 Institutional Benchmarks & Thresholds →
Statutory capital, clearing, margin & rate conventions.
Editorial Records
Authors & Review Records →
View named contributors where those records are available.
Complete Index
Master Research & Dossier Archive →
Browse all published briefings by topic pillar & date.