
Inflation Breakevens Real Rates
University of Michigan vs NY Fed SCE Inflation Expectations: Partisan Skew & Salience Bias
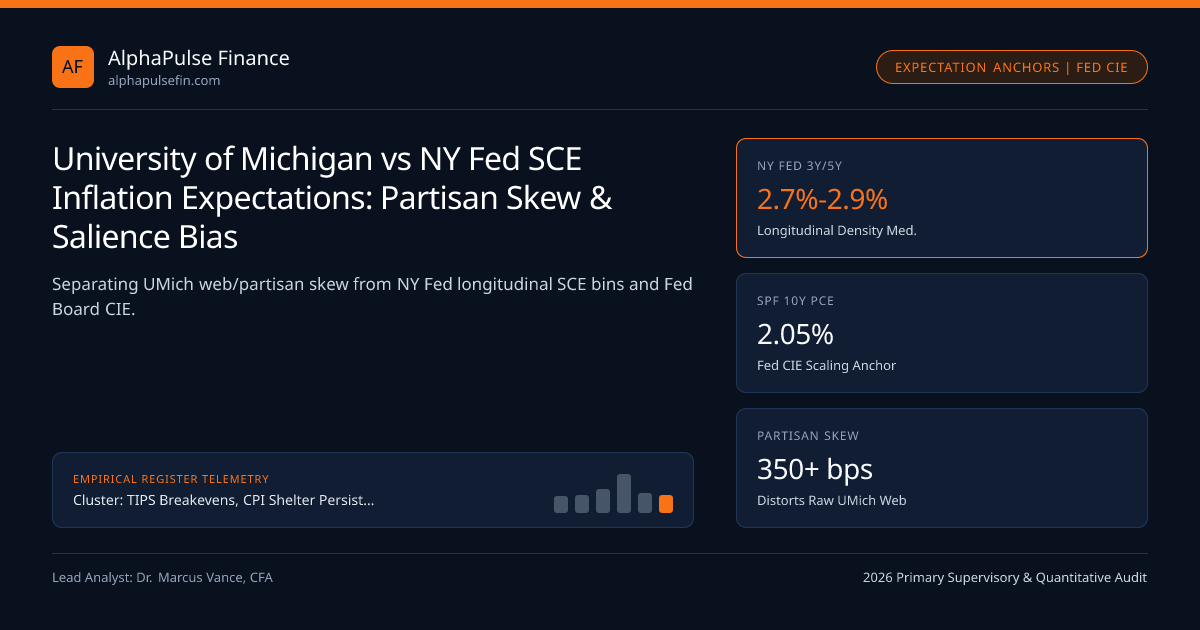
Methodological shifts to online sampling and acute partisan bimodal dispersion pushed University of Michigan 5-to-10-year inflation prints above 3.3% while the NY Fed Survey of Consumer Expectations and Fed CIE index stayed anchored near 2.7%-2.9%.
In June 2022, a single 0.2% preliminary Friday 10:00 AM ET uptick in the University of Michigan (UMich) 5-to-10-Year Consumer Inflation Expectations survey (from 3.1% to 3.3%, later revised back down to 3.1%!) famously prompted the FOMC to scrap its telegraphed 50-bps guidance over the weekend and hike 75 bps! Four years later in 2026, UMich 5-to-10-year numbers periodically jump above 3.4% to 3.9%—and bond markets barely flinch! Understanding why institutional desks and the Federal Reserve downgraded UMich relative to the NY Fed Survey of Consumer Expectations (SCE) and the Fed Board's Index of Common Inflation Expectations (CIE) protects TIPS and Core PCE traders from 10:00 AM Friday head-fakes.
Three Structural Flaws Inside UMich vs Longitudinal NY Fed SCE Design#
Compare the survey engineering of the University of Michigan Survey of Consumers (~500-900 respondents, transitioned in 2024 from landline/cell phone interviews to 100% Web-Based Self-Administered Surveys!) against the Federal Reserve Bank of New York SCE (1,300 rotating 12-month longitudinal panel households):
- Question Wording ("Prices in General" vs "Rate of Inflation/Deflation"): UMich asks open-ended "By about what percent per year do you expect prices in general* to go up/down?"—causing respondents thinking about grocery/gasoline sticker shock to blur cumulative price level* with annual % rates (producing >10% and 15%+ right-tail answers, ESPECIALLY after the 2024 switch from live human phone interviewers—who politely probed wild "25%!" answers—to unprobed web text boxes!). By contrast, NY Fed SCE asks explicitly for a probabilistic density histogram across 10 bins for the rate of inflation!
- Extreme Partisan Bimodal Split (>350 bps Gap!): Across 2024-2026 UMich micro-data, self-identified partisans of the out-of-White-House party report 4.8% to 6.2% inflation expectations while in-party partisans report 1.4% to 2.1%—turning headline UMich medians into a political-turnout artifact!
- Rotating Same-Household Panel (NY Fed SCE): Tracking the exact same household for 12 months eliminates month-to-month sample-composition noise!
Gasoline & Grocery Salience Bias vs Business CFO Surveys (Atlanta Fed BIE)#
Academic research (Coibion & Gorodnichenko; D’Acunto, Malmendier & Weber) demonstrates that households form 1-year inflation expectations primarily from the two prices they see most frequently without buying durable goods: retail pump gasoline and supermarket milk/eggs ("Frequency Salience Bias")!
- Because households overweight 3.3%-weight gasoline by ~5x, household surveys systematically overstate true CPI by +80 to +140 bps even in 2.0% inflation decades!
- Who actually sets economy-wide prices and wages? Corporate CFOs and pricing managers! Consequently, the Federal Reserve weights the Atlanta Fed Business Inflation Expectations (BIE, unit-cost expectations of 300+ firms) and Philadelphia Fed Survey of Professional Forecasters (SPF) heavily inside its quarterly Index of Common Inflation Expectations (CIE)!
- FedCIEFactort = Projectiononto10YSPFPCE( FirstDynamicFactor(21MarketProfFirmHHSeries_t) )
- Worked NY Fed SCE Individual Density Mean vs UMich Open-Ended Outlier Skew:
- Suppose 5% of web respondents type "25%" out of political frustration into UMich’s open text box:
- Pulls UMich Mean above 5.1% and nudges Median up +0.4% (from 3.0% to 3.4%)!
- In NY Fed SCE 10-Bin Probability Histogram (capped & fitted to parametric beta distribution):
- Bounded bin medians move < 0.05%, keeping 3Y/5Y SCE anchored at 2.8%!
Density-Mean NY Fed SCE vs Open-Ended Median & Fed CIE Factor Equations#
Extracting the common first principal component (CIE, Ahn & Fulton, Fed Board) across 21 market, professional, business, and household series filters out UMich web-survey noise automatically!
US Inflation Expectations Survey Architecture Comparison Matrix#
Intraday algorithmic trading desks across CFTC CME Treasury futures and dealers like Cantor Fitzgerald now fade >4-bps 10:00 AM Friday Treasury knee-jerks on preliminary UMich prints whenever NY Fed SCE 3-year/5-year and 5y5y ZCIS hold steady!
| Expectation Survey / Index | Administrator & Timing | Sample & Mode | Structural Quirk / Bias | Current FOMC Weight |
|---|---|---|---|---|
Index of Common Inf. Exp. (CIE) | Fed Board (Quarterly) | 21-Series Dynamic Factor | Lagging quarterly publication | Highest (Official Staff Anchor) |
NY Fed Consumer (SCE) | NY Fed (2nd Mon Monthly) | 1,300 Panel / Density Bins | Mild grocery/gas salience | High (Preferred Household) |
| Survey of Prof. Forecasters | Philly Fed (Quarterly) | ~40 Macro Economists | Slow to spot regime breaks | High (Kalman DKW Anchor) |
Univ. of Michigan (UMich) | UMich (2nd & 4th Fri) | ~600-900 Web Open-Text | Severe partisan + web outlier jump! | Downgraded (Fade Outliers) |
How to Trade Preliminary vs Final UMich Revisions & SCE Dispersion#
Notice a clean micro-edge on UMich release Fridays: Preliminary UMich (2nd Friday of the month) reflects only ~60%-65% of the monthly web sample and has exhibited +/-0.20% to 0.30% revision volatility into Final UMich two weeks later. By contrast, if both NY Fed SCE 3-Year/5-Year Density Median and Atlanta Fed Business Inflation Expectations break upward by +30 bps simultaneously, FOMC OIS reprices sustainably.
Cycle-comparison tables continue in TIPS Breakevens, CPI Shelter Persistence & Forward Real Rates, Real 2s10s TIPS Yield Curve Slope, and NSA CPI 3-Month Indexation Lag &; reference TIPS Breakevens and regulatory bodies for taxonomy standards.
Frequently asked questions
Why did UMich 5-to-10-year inflation expectations jump structurally after mid-2024 compared to NY Fed SCE?
Between April and July 2024, UMich completed a 100% methodological transition from live telephone interviews to web-based questionnaires. On phone calls, interviewers gently asked "Did you mean 20% per year for 10 years?" when respondents gave wild numbers; web forms record unprobed extremes directly!
How does the New York Fed Survey of Consumer Expectations (SCE) elicit probability distributions from ordinary households?
Instead of asking for one single point number, NY Fed gives respondents 100 percentage points to allocate across 10 inflation/deflation range bins (>12%, 8-12%, 4-8%, 2-4%, 0-2%, etc.), fitting a smooth individual density curve for every respondent!
Why do central bankers care about household expectations at all if 5y5y TIPS swaps and SPF economists are calmer?
Workers negotiate cost-of-living raises and decide whether to front-load durable purchases based on household expectations; if BOTH NY Fed SCE AND business unit-cost surveys (Atlanta Fed BIE) un-anchor together, a wage-price spiral can ignite.
What scale is the Federal Reserve Board’s Index of Common Inflation Expectations (CIE) reported in?
Although CIE extracts a dimensionless latent factor from 21 disparate series, Fed economists project (scale) it directly onto the Philadelphia Fed 10-Year PCE SPF mean/median—so a 2.05% CIE reading directly means "anchored at 2% PCE"!
Publication record
- Published
- November 13, 2026
- Updated
- November 14, 2026
- Author
- Dr. Marcus Vance, CFA
- Review
- Review not recorded
- Automated fact check
- Passed in the stored pipeline record
- Source URLs
- 3 recorded
AI assistance recorded: anthropic/claude-opus-4.6. This field does not establish human review or source verification.
Academic & Institutional Attribution
Cite This Research & Embed Live Data Card
Standard academic & institutional research paper citation format.
Dr. Marcus Vance, CFA. (2026, November 14). University of Michigan vs NY Fed SCE Inflation Expectations: Partisan Skew & Salience Bias. AlphaPulse Finance. https://alphapulsefin.com/analysis/michigan-ny-fed-sce-household-inflation-expectations-anchoringRelated Inflation Breakevens Real Rates & Institutional Briefings
Explore Inflation Breakevens Real Rates Hub (20) →Inflation Breakevens Real Rates
TIPS Breakevens, CPI Shelter Persistence & Forward Real Rates: Institutional GuideInflation Breakevens Real Rates
Real 2s10s TIPS Yield Curve Slope: Auditing Ex-Ante FOMC Monetary RestrictivenessInflation Breakevens Real Rates
5y5y Forward Inflation Swaps vs TIPS Breakevens: Stripping Out Oil & Liquidity NoiseInflation Breakevens Real Rates
BLS CPI Shelter Persistence: 6-Month OER Panel Rotation vs New-Tenant Repeat Rent LagsInflation Breakevens Real Rates
BEA Core PCE vs BLS Core CPI Wedge: Scope, Weight & Fisher Substitution DecompositionInflation Breakevens Real Rates
TIPS Par Deflation Floor Convexity: Pricing Embedded 0% Put Options Across Issue VintagesInflation Breakevens Real Rates
10-Year TIPS Real Yields & S&P 500 Forward P/E Compression: Equity Duration RegimesInflation Breakevens Real Rates
NSA CPI 3-Month Indexation Lag & Front-End TIPS Seasonal Carry/Roll MechanicsInstitutional Earnings Capex Macro
Nominal GDP Deceleration & S&P 500 Margins: Decomposing Price/Mix vs Real Unit Volume LeverageMarket Insights
Gold Dims Amid Rising Fed Rate-Hike ExpectationsMarket Insights
U.S. Stocks Gain After CoreWeave Update Eases Some AI ConcernsEarnings Reports
Brookfield Earnings Buoyed by Fund Raising, Wealth Solutions Growth
AlphaPulse Finance Data, Benchmarks & Contributor Records
CC BY 4.0 Open Data
Open Institutional Datasets (CSV / JSON) →
Download desk-compiled quantitative series & schemas.
2026 Reference Matrix
2026 Institutional Benchmarks & Thresholds →
Statutory capital, clearing, margin & rate conventions.
Editorial Records
Authors & Review Records →
View named contributors where those records are available.
Complete Index
Master Research & Dossier Archive →
Browse all published briefings by topic pillar & date.