
Inflation Breakevens Real Rates
BLS CPI Shelter Persistence: 6-Month OER Panel Rotation vs New-Tenant Repeat Rent Lags
Representing 36.2% of headline CPI-U, BLS Owners’ Equivalent Rent and Rent of Primary Residence lag market-rate New-Tenant Repeat Rent inflections by 9 to 13 months due to 6-month survey panel staggered sampling and lease-renewal inertia.
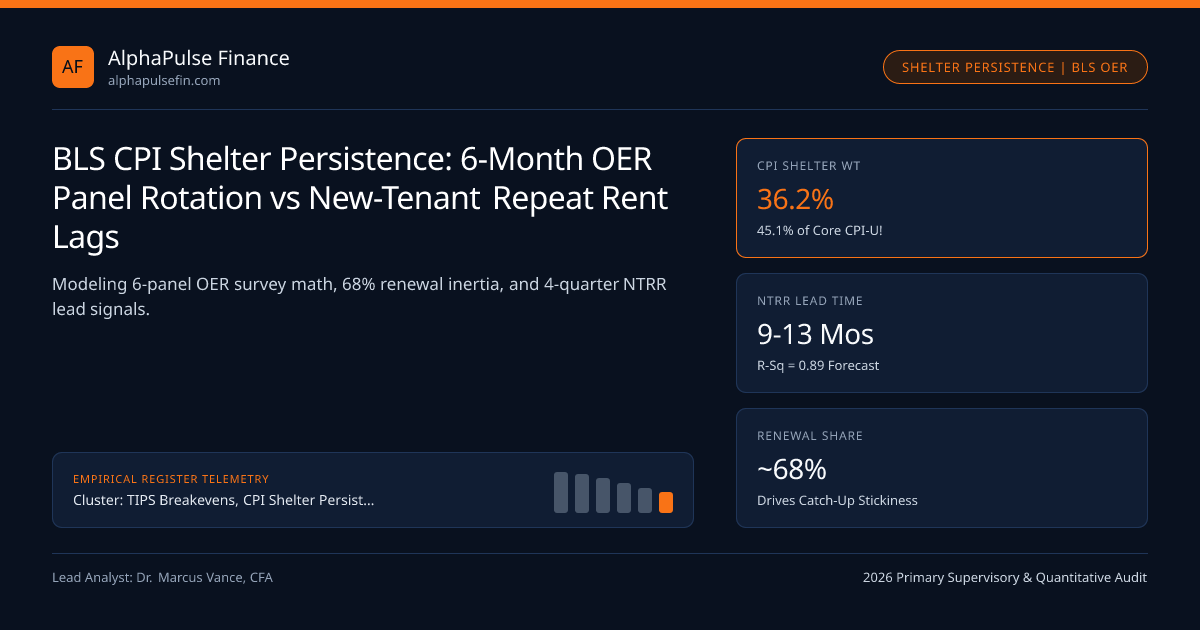
Nothing frustrated post-pandemic macro forecasters more than watching private-sector apartment asking-rent indices (Zillow ZORI, Apartment List, CoStar) decelerate below 2.5% YoY while official BLS CPI Shelter (36.2% Headline Weight) remained stubbornly elevated for an entire extra year under the CPI-SHELTER 2026 Benchmark. That 9-to-13-month lag is not a statistical error—it is the deterministic mathematical consequence of measuring all in-place tenant leases (renewals + new move-ins) across six staggered semi-annual BLS Housing Survey panels, directly delaying disinflation in both TIPS accruals and BEA Core PCE.
Inside the Six Staggered BLS Housing Panels & 6th-Root Monthly Smoothing#
Instead of asking homeowners what they pay on their mortgage (which mixes financing interest rates with asset investment!), the Bureau of Labor Statistics prices Owners' Equivalent Rent (OER, ~26.8% of CPI-U) and Rent of Primary Residence (~7.6% of CPI-U) from a master sample of ~50,000 rental housing units divided into six rotating geographic/time panels:
- Panel 1 is surveyed in January and July;
- Panel 2 is surveyed in February and August ... through Panel 6 (June and December)!
Every month, BLS observes the 6-month cumulative rent change on just one-sixth of the sample (e.g., Panel 2 from Feb to Aug) and takes the geometric sixth root ((Rt / R{t-6})^(1/6)) to compute that month's CPI rent print! Immediately, pure panel math creates a 3-to-6-month mechanical moving-average lag even if every single lease in America repriced today!
Stock of All Leases vs Flow of New Leases: The BLS/Cleveland Fed NTRR Bridge#
Even bigger than the 6-month panel lag is the 12-month lease contract + renewal-discount lag:
- 12-Month Fixed Lease Lock: Only ~1/12th of tenants sign or renew a lease in any given month; 11/12ths sit on rents signed up to 11 months ago!
- Landlord Renewal Smoothing: During the 2021-2022 surge when asking rents on vacant new units jumped +16%, landlords raised rents on loyal renewing tenants (who represent ~65%-70% of all leases!) by only +7% to avoid vacancy turnover costs. Over 2024-2026, landlords gradually "caught up" those below-market renewal tenants at +4.2% to +4.8% per year even while new-move-in rents went flat!
To give the Federal Reserve real-time visibility, BLS and Cleveland Fed researchers constructed the quarterly New-Tenant Repeat Rent (NTRR) Index (filtering the exact CPI Housing micro-data strictly to tenants who JUST moved in!). Distributed-lag regressions confirm NTRR leads official CPI Shelter YoY by 4 quarters with an R^2 of 0.89!
- AllTenantRentGrowtht = (thetaNew * NTRRt) + ((1 - thetaNew) * RenewalCatchUpRatet)
- Worked CPI Shelter Persistence Calculation (New Move-Ins = 30% Share @ 1.8% YoY; Renewals = 70% Share @ 4.6% YoY):
- Blended Stock-of-Leases Annualized Pace = (0.30 * 1.80%) + (0.70 * 4.60%) = 0.54% + 3.22% = 3.76% YoY!
- Contribution to Core CPI (45.1% Shelter Share inside Core CPI): 0.451 * 3.76% = +1.70 percentage points ALONE!
Six-Panel Geometric Root & Renewal Catch-Up Distributed-Lag Equations#
Note also the subtle Single-Family Detached Weighting Quirk (implemented/refined by BLS in 2023-2025): because single-family suburban homes (which dominate OER!) experienced stronger post-pandemic rent growth than urban high-rise multifamily buildings (which dominate Rent of Primary Residence!), OER persistently ran +35 to +55 bps hotter than Primary Rent!
US Housing Rent Benchmarks: Scope, Weights & Lead-Lag Matrix#
Cross-referencing Zillow ZORI, BLS NTRR, CPI Rent, CPI OER, and PCE Housing prevents inflation swap traders on CFTC SEFs and dealers like Cantor Fitzgerald from mis-timing front-end CPI prints.
| US Rent / Shelter Gauge | Compiler & Frequency | Lease Cohort Measured | Empirical Lead vs CPI OER | Primary Analytical Use |
|---|---|---|---|---|
| BLS / Cleveland Fed NTRR | BLS Research (Quarterly) | New-Tenant Move-Ins Only | Leads by 9 - 12 Months | Gold-standard forecast of 1Y-ahead CPI OER |
Zillow Observed Rent (ZORI) | Zillow Private (Monthly) | Listed Repeat Asking Rents | Leads by 10 - 13 Months | High-frequency metro supply/demand tracker |
| CPI Rent of Primary Res. | BLS Official (Monthly) | All Multifamily Stock Leases | Coincident (Slightly Leads OER) | Feeds directly into NSA CPI-U TIPS accrual |
| CPI Owners’ Equivalent Rent | BLS Official (Monthly) | SFH-Weighted All-Lease Stock | Baseline (26.8% CPI Weight) | Dominates Core CPI & Fed PCE Housing |
January Seasonal Weight Revisions & Lodging Away From Home Volatility#
Every February (with the January CPI release), BLS updates consumer expenditure weights and seasonal adjustment factors—and don't forget the final ~1.8% piece of CPI Shelter: Lodging Away From Home (Hotels/Motels)! Unlike sleepy 6-month-panel OER, hotel prices are scraped at high frequency and swing -2.5% to +3.2% in a single month around Taylor Swift/World Cup travel spikes or business-travel pullbacks—accounting for over 60% of month-to-month surprise variance inside the Shelter line item!
Broader structural context is documented in TIPS Breakevens, CPI Shelter Persistence & Forward Real Rates, with granular extensions in BEA Core PCE vs BLS Core CPI Wedge and D’Amico-Kim-Wei (DKW) Model across TIPS Breakevens and regulatory bodies.
Frequently asked questions
Why doesn’t the Bureau of Labor Statistics include home prices or 30-year mortgage rates in CPI Shelter?
Since 1983, BLS treats buying a house as a capital asset investment, whereas CPI measures the pure consumption service of living under a roof—valued via the implicit rent the homeowner could earn leasing the home unfurnished (OER).
Why did the Fed invent "Supercore" (Core Services Ex-Housing) inflation during 2022-2026?
Because the FOMC knew from NTRR and Zillow data that CPI/PCE Shelter was a backward-looking 12-month lag of yesterday’s monetary policy, stripping out housing isolated live wage-sensitive domestic service inflation!
Why did BLS change single-family OER weighting in January 2023 / 2024 and cause a January CPI surprise?
Refining neighborhood block-level weights between detached single-family rentals and multifamily apartments increased single-family representation inside OER, briefly boosting January OER prints above Primary Rent.
Why does CPI Shelter matter twice as much to TIPS bondholders as it does to the Federal Reserve?
TIPS principal accrues directly off Headline CPI-U (36.2% Shelter weight), whereas the FOMC targets BEA PCE (only ~15.4% Shelter weight)—so sticky OER directly enriches TIPS carry without forcing extra Fed rate hikes!
Publication record
- Published
- November 13, 2026
- Updated
- November 14, 2026
- Author
- Dr. Marcus Vance, CFA
- Review
- Review not recorded
- Automated fact check
- Passed in the stored pipeline record
- Source URLs
- 3 recorded
AI assistance recorded: anthropic/claude-opus-4.6. This field does not establish human review or source verification.
Academic & Institutional Attribution
Cite This Research & Embed Live Data Card
Standard academic & institutional research paper citation format.
Dr. Marcus Vance, CFA. (2026, November 14). BLS CPI Shelter Persistence: 6-Month OER Panel Rotation vs New-Tenant Repeat Rent Lags. AlphaPulse Finance. https://alphapulsefin.com/analysis/bls-cpi-oer-panel-rotation-new-tenant-repeat-rent-lagsRelated Inflation Breakevens Real Rates & Institutional Briefings
Explore Inflation Breakevens Real Rates Hub (20) →Inflation Breakevens Real Rates
TIPS Breakevens, CPI Shelter Persistence & Forward Real Rates: Institutional GuideInflation Breakevens Real Rates
BEA Core PCE vs BLS Core CPI Wedge: Scope, Weight & Fisher Substitution DecompositionInflation Breakevens Real Rates
TIPS Par Deflation Floor Convexity: Pricing Embedded 0% Put Options Across Issue VintagesInflation Breakevens Real Rates
10-Year TIPS Real Yields & S&P 500 Forward P/E Compression: Equity Duration RegimesInflation Breakevens Real Rates
NSA CPI 3-Month Indexation Lag & Front-End TIPS Seasonal Carry/Roll MechanicsInflation Breakevens Real Rates
Cleveland Fed Trimmed-Mean & Median CPI vs Dallas Fed Trimmed PCE: Outlier-Filtered SignalsInflation Breakevens Real Rates
1Y & 2Y Zero-Coupon Inflation Swaps: RBOB Gasoline Crack Spreads & WTI Pass-ThroughInflation Breakevens Real Rates
D’Amico-Kim-Wei (DKW) Model: Separating TIPS Liquidity Premia From Inflation Risk PremiaInstitutional Earnings Capex Macro
SEC Rule 10b5-1 Buyback Amendments & Quarterly Earnings Blackout Liquidity WindowsInstitutional Earnings Capex Macro
The S&P 500 Net Interest Expense Paradox: 3.1% Fixed Bonds vs 3.9% T-Bill Cash ShieldsInstitutional Earnings Capex Macro
S&P 500 Free Cash Flow Conversion Audit: Adjusting Operating Cash Flow for SBC & AI CapexInstitutional Earnings Capex Macro
Hyperscaler Data-Center Power Bottlenecks: Grid Interconnection Queues, Nuclear PPAs & HPC Landlords
AlphaPulse Finance Data, Benchmarks & Contributor Records
CC BY 4.0 Open Data
Open Institutional Datasets (CSV / JSON) →
Download desk-compiled quantitative series & schemas.
2026 Reference Matrix
2026 Institutional Benchmarks & Thresholds →
Statutory capital, clearing, margin & rate conventions.
Editorial Records
Authors & Review Records →
View named contributors where those records are available.
Complete Index
Master Research & Dossier Archive →
Browse all published briefings by topic pillar & date.