
Inflation Breakevens Real Rates
Cleveland Fed Trimmed-Mean & Median CPI vs Dallas Fed Trimmed PCE: Outlier-Filtered Signals
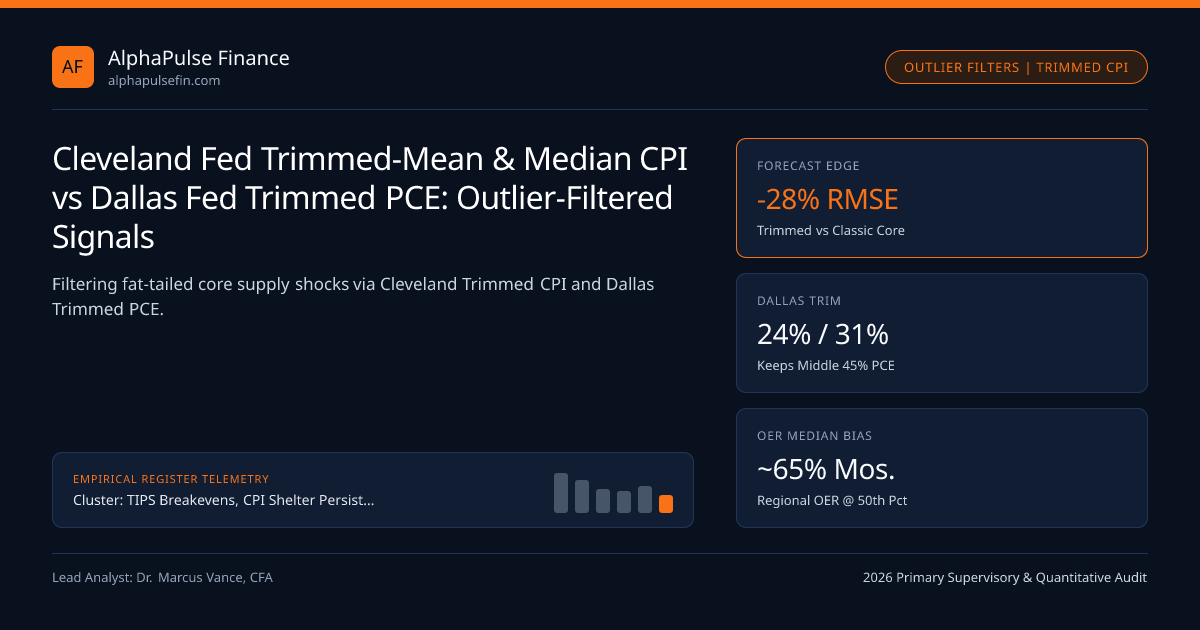
Outlier-filtered inflation gauges—Cleveland Fed Median CPI, 16% Trimmed-Mean CPI, and Dallas Fed Trimmed-Mean PCE—outperform traditional ex-food-and-energy Core indices by 28% RMSE in forecasting 24-month-ahead headline inflation.
Excluding food and energy ("Core Inflation") was an ad-hoc shortcut invented during the 1973 OPEC embargo and food shocks—yet in the 2020s, the wildest monthly inflation outliers came inside Core (used cars +42%, egg avian flu spikes, airfares -18%, auto insurance +21%)! To prevent fat-tailed right-or-left relative-price shocks from fooling Federal Reserve monetary policy, regional Reserve Bank econometricians track Order-Statistic Trimmed Estimators—led by Cleveland Fed 16% Trimmed-Mean & Median CPI, Dallas Fed Trimmed-Mean PCE, and Atlanta Fed Sticky-Price CPI—alongside BEA Core PCE and BLS CPI Shelter.
Why Symmetric & Asymmetric Order-Statistic Trimming Beats Ex-Food-and-Energy#
Cross-sectional monthly US consumer price changes across 45 CPI components (or 178 PCE components!) are NOT normally distributed—they are leptokurtic (fat-tailed, kurtosis > 9!) and positively skewed during supply shocks! Basic mathematical statistics (Bryan, Cecchetti & Wiggins, 1997) proves that when sampling from a fat-tailed distribution, the sample Mean is an inefficient, noisy estimator of central tendency, whereas Trimmed Means and the Median minimize mean-squared forecast error:
- Cleveland Fed 16% Trimmed-Mean CPI: Ranks all 45 CPI components each month from lowest MoM change to highest, chops off 8% of expenditure weight from the bottom tail AND 8% from the top tail (16% total trimmed), and computes the weighted average of the middle 84%—dynamically discarding eggs or used cars or gasoline without arbitrary pre-selection!
- Dallas Fed Trimmed-Mean PCE (Asymmetric 24% Lower / 31% Upper Trim!): Because granular 178-line PCE exhibits chronic right-skewness, Dallas Fed optimizes asymmetric tail cuts (trimming 24% off the bottom and 31% off the top, keeping the middle 45%) so its long-run mean stays unbiased relative to Headline PCE!
Watch the "Median CPI Trap": When 26.8% OER Monopolizes the 50th Percentile!#
Before treating Cleveland Fed Median CPI (50% trimmed off each side!) as infallible gospel, institutional inflation strategists at desks like Cantor Fitzgerald verify which component landed on the 50th expenditure percentile!
Because BLS breaks Owners' Equivalent Rent into four regional cells (Northeast, Midwest, South, West—totaling ~26.8% of CPI!), whenever regional OER sits near the middle of the distribution, one of the four regional OER housing blocks lands on the 50th percentile over 65% of all months! During 2023-2025, when lagging 6-month-panel OER was stuck at +5.2% while goods and non-housing services had already cooled to +2.1%, Median CPI stayed artificially pinned near 4.2% purely because OER monopolized the median—making 16% Trimmed-Mean CPI and Dallas Trimmed PCE far cleaner real-time turning-point gauges!
- StickyPriceCalvoPricing: p*t = (1 - theta * beta) * SUM{k=0..inf} (theta * beta)^k * Et[ MC{t+k} + P{t+k} ]
- Worked Core CPI Outlier Distortion vs 16% Trimmed-Mean Filter:
- Suppose Used Cars (2.4% wt) jump +4.5% MoM and Auto Insurance (2.9% wt) jumps +2.1% MoM -> adds +0.17% MoM (+2.0% ann.) to Core CPI!
- Both items sit inside the top 8% right tail (5.3% combined < 8.0% upper cut) -> 16% Trimmed-Mean CPI excises 100% of both spikes!
Atlanta Fed Sticky-Price vs Flexible-Price Forward Expectations Theory#
New Keynesian Menu-Cost Theory (Calvo pricing) adds a second orthogonal filter: price-change frequency! Restaurant menus, medical fees, and haircuts (Sticky Prices, changing every >4.3 months) MUST build future expected inflation into today's price hike because they won't reprice again for a year, whereas gasoline and used cars (Flexible Prices, changing every <4.3 months) reflect only spot inventory clearing!
Regional Federal Reserve Underlying Inflation Gauge Comparison Matrix#
FOMC Tealbook staff briefings watched by SEC and CFTC macro funds synthesize all four regional Fed filters into a unified "Underlying Inflation Dashboard" ahead of each rate decision.
| Regional Fed Gauge | Publishing Reserve Bank | Statistical Filter Rule | Key Blind Spot to Watch | Best Signal Window |
|---|---|---|---|---|
| 16% Trimmed-Mean CPI | Cleveland Fed (CPI Day) | Symmetric 8% Bottom / 8% Top | Still carries heavy CPI OER weight | Early CPI-morning trend check |
Median CPI (50th Pct) | Cleveland Fed (CPI Day) | 50% Bottom / 50% Top Cut | Dominated 65% of time by regional OER! | False-dawn warning in 2021 surge |
| Trimmed-Mean PCE | Dallas Fed (PCE Day) | Asymmetric 24% Low / 31% High | Released 2 weeks after CPI/PPI | Cleanest FOMC policy signal |
| Sticky Core CPI Ex-Shelter | Atlanta Fed (CPI Day) | Items repricing > every 4.3 mos. | Smaller sub-basket sample size | Pure domestic menu-cost expectations |
Breadth Diffusion Signals: Share of PCE Basket Growing >3% vs <2% Annualized#
Alongside trimmed means, San Francisco and Dallas Fed inflation breadth trackers measure the expenditure share of the 178 PCE items rising faster than 3.0% annualized. Historically, FOMC cutting cycles tracked on CME SOFR futures only prove durable once the >3% inflation breadth share drops below 42% (down from 78% in 2022), confirming disinflation is broad-based rather than carried by plunging imported electronics offsetting 5% domestic services.
Macro allocation frameworks connect this note to TIPS Breakevens, CPI Shelter Persistence & Forward Real Rates, 1Y & 2Y Zero-Coupon Inflation Swaps, and Zero-Coupon vs Year-on-Year Inflation Caps & Floors, indexed under TIPS Breakevens alongside verification registry.
Frequently asked questions
Why did Cleveland Fed Median and Trimmed-Mean CPI catch the 2021 inflation surge six months before "Transitory" models?
In spring 2021, consensus economists dismissed Core CPI as "just used cars and reopening travel," but Trimmed-Mean CPI automatically cut out used cars/hotels AND STILL jumped from 2.0% to 4.1%—proving inflation breadth had already generalized!
Why does the Dallas Fed trim MORE off the top tail (31%) than the bottom tail (24%) in Trimmed-Mean PCE?
Individual monthly price increases are positively skewed (firms hike prices in infrequent +8% steps while rarely cutting nominal prices). Symmetric trimming would systematically understate average PCE by ~20 bps/yr unless asymmetrically calibrated!
How fast after the 8:30 AM ET BLS CPI release does the Cleveland Fed publish Median and Trimmed-Mean CPI?
Usually between 10:30 AM and 11:30 AM ET on the exact morning of the BLS CPI release, giving STIR and TIPS desks same-day confirmation of whether an 8:30 AM Core surprise was narrow noise or broad breadth.
What is the New York Fed’s Multivariate Core Trend (MCT) PCE model?
Complementing Dallas Fed’s statistical cross-item trim, NY Fed’s MCT uses a dynamic factor Kalman filter across 17 PCE sectors to separate persistent common cross-sector shocks from sector-specific transient spikes.
Publication record
- Published
- November 13, 2026
- Updated
- November 14, 2026
- Author
- Dr. Marcus Vance, CFA
- Review
- Review not recorded
- Automated fact check
- Passed in the stored pipeline record
- Source URLs
- 3 recorded
AI assistance recorded: anthropic/claude-opus-4.6. This field does not establish human review or source verification.
Academic & Institutional Attribution
Cite This Research & Embed Live Data Card
Standard academic & institutional research paper citation format.
Dr. Marcus Vance, CFA. (2026, November 14). Cleveland Fed Trimmed-Mean & Median CPI vs Dallas Fed Trimmed PCE: Outlier-Filtered Signals. AlphaPulse Finance. https://alphapulsefin.com/analysis/cleveland-fed-trimmed-mean-median-cpi-sticky-price-filtersRelated Inflation Breakevens Real Rates & Institutional Briefings
Explore Inflation Breakevens Real Rates Hub (20) →Inflation Breakevens Real Rates
TIPS Breakevens, CPI Shelter Persistence & Forward Real Rates: Institutional GuideInflation Breakevens Real Rates
1Y & 2Y Zero-Coupon Inflation Swaps: RBOB Gasoline Crack Spreads & WTI Pass-ThroughInflation Breakevens Real Rates
D’Amico-Kim-Wei (DKW) Model: Separating TIPS Liquidity Premia From Inflation Risk PremiaInflation Breakevens Real Rates
Core PCE Imputed Financial Services & Portfolio Management Fees: S&P 500 Equity Beta in InflationInflation Breakevens Real Rates
30-Year TIPS Real Yield Auctions: February/August Supply Liquidity & Real-Annuity LDI DemandInflation Breakevens Real Rates
BLS CPI Health Insurance Retained-Earnings Method: October Resets vs BEA PPI Medical CareInflation Breakevens Real Rates
Import Tariff Pass-Through Into Core Goods: Price-Level Step Jumps & 2s10s Breakeven InversionInflation Breakevens Real Rates
Zero-Coupon vs Year-on-Year Inflation Caps & Floors: Tail Volatility Smiles & Regime ProbabilitiesInstitutional Earnings Capex Macro
Consensus EPS Revision Breadth & SEC Reg FD Preannouncements: Modeling the +3.8% "Beat" GameInstitutional Earnings Capex Macro
S&P 500 Five-Factor DuPont ROE Attribution: Operating Margin vs Tax & Leverage DriversInstitutional Earnings Capex Macro
Russell 2000 Floating SOFR Debt Wall vs S&P 500 Fixed Coupons: Small-Cap Earnings CompressionInstitutional Earnings Capex Macro
Corporate Cash Conversion Cycle (DSO, DIO, DPO): Working Capital Forensics & ASC 405-50 Debt
AlphaPulse Finance Data, Benchmarks & Contributor Records
CC BY 4.0 Open Data
Open Institutional Datasets (CSV / JSON) →
Download desk-compiled quantitative series & schemas.
2026 Reference Matrix
2026 Institutional Benchmarks & Thresholds →
Statutory capital, clearing, margin & rate conventions.
Editorial Records
Authors & Review Records →
View named contributors where those records are available.
Complete Index
Master Research & Dossier Archive →
Browse all published briefings by topic pillar & date.