
Inflation Breakevens Real Rates
1Y & 2Y Zero-Coupon Inflation Swaps: RBOB Gasoline Crack Spreads & WTI Pass-Through
Motor fuel accounts for just ~3.3% of the CPI-U basket yet drives over 58% of monthly Headline CPI variance—linking 1-year Zero-Coupon Inflation Swaps directly to NYMEX RBOB gasoline futures and 3-2-1 refinery crack spreads.
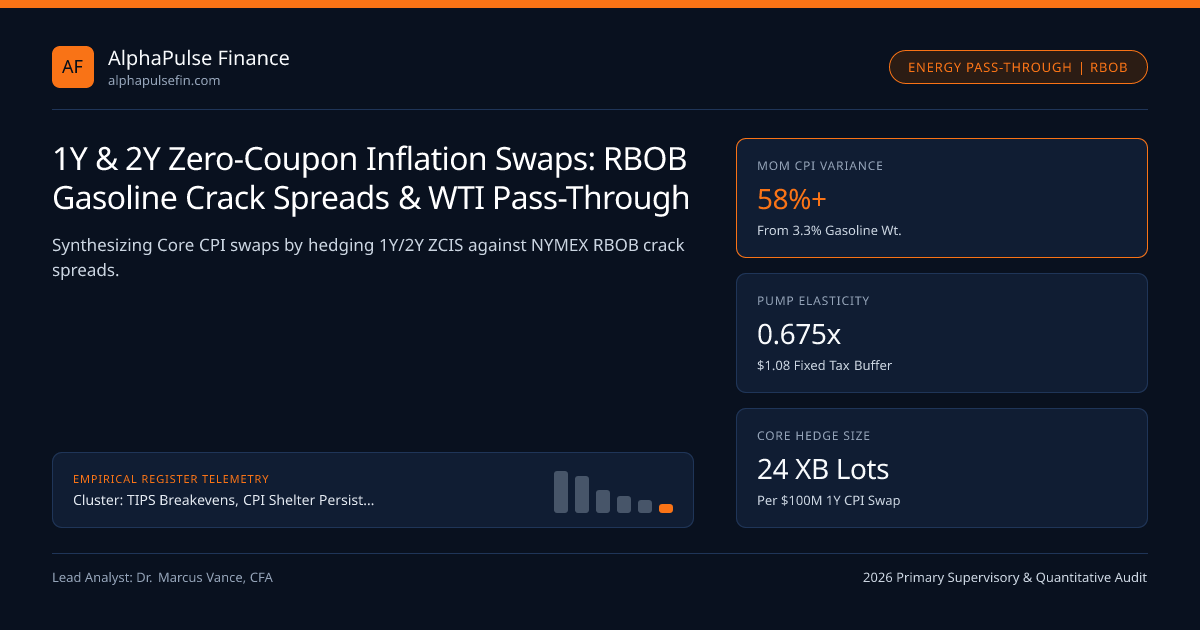
Motor fuel (unleaded regular, midgrade, premium, and diesel) represents only ~3.3% of the US CPI-U basket, yet because retail pump prices swing +/-35% year-over-year, gasoline drives more than 58% of month-to-month Headline CPI variance! Even more critically for inflation traders on CFTC-supervised swap venues, hedging 1-Year and 2-Year Zero-Coupon Inflation Swaps (ZCIS) with WTI or Brent crude oil futures is a rookie mistake: hurricane refinery outages and EPA RVP summer-blend bottlenecks routinely blow out NYMEX RBOB Gasoline 3-2-1 Crack Spreads, sending 1-year inflation swaps +35 bps higher on days when WTI crude oil is flat!
Why NYMEX RBOB Futures—Not WTI Crude—Govern Headline CPI Energy#
Trace the exact physical-to-statistical chain from NYMEX futures to BLS pump price surveys:
- WTI Crude Oil ($/bbl) + Refinery Crack Spread ($/bbl) = Wholesale NYMEX RBOB ($/gal): A barrel of $70 WTI crude equals $1.67/gallon of raw oil. Adding a $24/bbl ($0.57/gal) refinery crack spread brings wholesale NYMEX RBOB to $2.24/gallon.
- Fixed Federal/State Excise Taxes + Retail Station Margin (~$1.08/gal Constant Cushion!): Adding ~54 cents/gal of federal/state fuel taxes plus ~54 cents/gal of pipeline/marketing/retail margin yields a $3.32/gallon AAA national retail pump price!
Notice the Tax Attenuation Dampener: because the $1.08/gal tax + distribution wedge is fixed in cents, a +10% jump in wholesale NYMEX RBOB (+$0.224/gal) raises retail AAA pump prices by only +6.75% ($0.224 / $3.32)—which, multiplied by a 3.30% CPI Motor Fuel weight, adds +22.3 bps instantaneously to Headline CPI level (and +22.3 bps directly to 1-Year ZCIS!)!
Second-Round Freight & Jet-Fuel Spillover Into Core CPI & FOMC Reaction#
While direct pump gasoline sits outside BEA Core PCE, energy shocks leak into Core Services and FOMC Corridor discussions via two measurable channels:
- Jet Fuel (Gulf Coast Kerosene Crack) -> Airline Fares (1-to-3 Month Lag): Fuel represents ~26% of major US airline operating expenses; a +25% jet-fuel surge lifts CPI/PPI airfares by +4.5% to +6.5% within 60 days.
- Diesel (ULSD Heating Oil Futures) -> Food-at-Home & Core Goods Freight (3-to-6 Month Lag): Trucking fuel surcharges pass roughly 8% to 12% of a sustained diesel move into grocery and retail goods margins.
Cross-asset inflation desks at primary dealers like Cantor Fitzgerald and Capitals Gain run automated Intraday RBOB-Adjusted Breakeven Models: stripping live intraday NYMEX RBOB ticks out of 1Y and 2Y ZCIS quotes in real time to see whether ex-energy Core CPI swaps actually moved!
- Delta1YZCISbps = 10,000 * WeightMotorFuel * PumpElasticitytoRBOB * (%Change12MForwardRBOB)
- Worked Synthetic "Core 1-Year Inflation Swap" Construction ($100M Notional, RBOB = $2.24/gal, Pump = $3.32/gal):
- Pump Elasticity = $2.24 / ($2.24 + $1.08) = 0.6747 | CPI Dollar Beta = 3.30% * 0.6747 = 2.227% of Swap Notional
- Required Short Dec-Forward NYMEX RBOB Notional = $100,000,000 * 0.02227 = $2,227,000 (~24 NYMEX XB contracts @ $94,080 each!)
- Result: If Hurricane shuts Gulf Refineries & RBOB spikes +20%, +44.5bp ZCIS gain offsets -$445K RBOB short -> Pure Core Exposure!
Exact RBOB-to-1Y-ZCIS Pass-Through & Tax-Dampener Beta Equations#
Observe the nonlinear convexity when retail gas is $5.00/gal vs $2.80/gal: at $5.00/gal, the fixed $1.08 tax cushion shrinks as a share of pump price (78% wholesale pass-through!), increasing CPI beta to RBOB!
Energy Commodity Futures Pass-Through Matrix Into US CPI & PCE#
Don't overlook Henry Hub Natural Gas -> Utility Piped Gas Service (~0.8% CPI weight): regulated municipal gas utilities pass Henry Hub winter spikes through Purchased Gas Adjustment (PGA) riders with a 1-to-2-month lag.
| Energy Sub-Component | CPI-U Basket Weight | CME / ICE Futures Hedge | Pass-Through Elasticity | Lag Into Official BLS Print |
|---|---|---|---|---|
Motor Fuel (Gasoline) | 3.30% | NYMEX RBOB (XB) | 0.675x (Fixed Tax Buffer) | 8 - 12 Days (AAA Daily Track) |
Utility Piped Gas (Heat) | 0.78% | NYMEX Henry Hub (NG) | 0.38x (Delivery Fee Buffer) | 30 - 60 Days (State PUC Rider) |
Electricity (Residential) | 2.52% | Regional Power / NatGas | 0.18x (Grid Capex Heavy) | 3 - 9 Months (Rate Case Lag) |
Airline Fares (Indirect Core) | 0.85% | Gulf Jet / ULSD (HO) | 0.24x (26% Airline Fuel Cost) | 45 - 75 Days (Core Spillover) |
Trading "Ex-RBOB Core Breakevens" by Hedging 2Y TIPS With RBOB Strips#
Suppose you believe Core Services inflation will surprise +30 bps higher over the next 12 months, but you fear an OPEC+ production hike could crash oil to $55 and wipe out your 1Y/2Y TIPS breakeven trade! Institutional macro pods buy 2-Year Cash TIPS Breakevens (or Pay 1Y ZCIS) and simultaneously Short a 12-Month Strip of NYMEX RBOB Gasoline Futures (42,000 gallons per contract, ~$94K notional per lot) sized at *~3.3% 0.68 = 2.24% notional (~$2.24M RBOB short per $100M 1Y ZCIS!)—synthetically manufacturing a Pure US Core CPI Breakeven** unavailable on cash bond screens!
For end-to-end regime mapping, consult TIPS Breakevens, CPI Shelter Persistence & Forward Real Rates, sibling briefs D’Amico-Kim-Wei (DKW) Model and Employment Cost Index (ECI) vs Average, TIPS Breakevens, and analytical tools.
Frequently asked questions
Why does the US lack a liquid OTC "Core CPI Swap" market, forcing traders to hedge Headline CPI swaps with RBOB?
Because all $2.1T of US Treasury TIPS and corporate inflation-linked bonds index legally to Headline NSA CPI-U, 99.8% of natural issuer and pension liquidity pools in Headline CPI swaps—making DIY RBOB-hedged Core swaps far tighter in bid-ask!
How accurately does the AAA Daily National Fuel Gauge predict the monthly BLS CPI Gasoline print?
Tracking AAA’s daily pump average across the exact calendar month (adjusted for BLS seasonal factors) predicts the official BLS CPI Motor Fuel sub-index with an R-squared above 0.98 before CPI release morning!
Why do RBOB futures always trade in backwardation from August to October ("summer-to-winter cliff")?
Before September 15, EPA Clean Air Act rules mandate expensive low-Reid-Vapor-Pressure (RVP) summer gasoline; after September 15, refiners blend cheap butane into winter-grade gasoline, dropping wholesale RBOB 18-28 cents/gal every autumn!
Why has US Residential Electricity CPI accelerated (+4.5% YoY) even when Henry Hub Natural Gas stayed cheap?
Over 60% of residential electric bills now pay for transmission/distribution grid hardening, wildfire mitigation, and hyperscaler data-center peak-capacity upgrades approved by state utility commissions rather than raw gas fuel burn!
Publication record
- Published
- November 13, 2026
- Updated
- November 14, 2026
- Author
- Dr. Marcus Vance, CFA
- Review
- Review not recorded
- Automated fact check
- Passed in the stored pipeline record
- Source URLs
- 3 recorded
AI assistance recorded: anthropic/claude-opus-4.6. This field does not establish human review or source verification.
Academic & Institutional Attribution
Cite This Research & Embed Live Data Card
Standard academic & institutional research paper citation format.
Dr. Marcus Vance, CFA. (2026, November 14). 1Y & 2Y Zero-Coupon Inflation Swaps: RBOB Gasoline Crack Spreads & WTI Pass-Through. AlphaPulse Finance. https://alphapulsefin.com/analysis/front-end-zero-coupon-inflation-swaps-rbob-gasoline-pass-throughRelated Inflation Breakevens Real Rates & Institutional Briefings
Explore Inflation Breakevens Real Rates Hub (20) →Inflation Breakevens Real Rates
TIPS Breakevens, CPI Shelter Persistence & Forward Real Rates: Institutional GuideInflation Breakevens Real Rates
D’Amico-Kim-Wei (DKW) Model: Separating TIPS Liquidity Premia From Inflation Risk PremiaInflation Breakevens Real Rates
Core PCE Imputed Financial Services & Portfolio Management Fees: S&P 500 Equity Beta in InflationInflation Breakevens Real Rates
30-Year TIPS Real Yield Auctions: February/August Supply Liquidity & Real-Annuity LDI DemandInflation Breakevens Real Rates
BLS CPI Health Insurance Retained-Earnings Method: October Resets vs BEA PPI Medical CareInflation Breakevens Real Rates
Import Tariff Pass-Through Into Core Goods: Price-Level Step Jumps & 2s10s Breakeven InversionInflation Breakevens Real Rates
Zero-Coupon vs Year-on-Year Inflation Caps & Floors: Tail Volatility Smiles & Regime ProbabilitiesInflation Breakevens Real Rates
Employment Cost Index (ECI) vs Average Hourly Earnings & Atlanta Fed Wage TrackerInstitutional Earnings Capex Macro
S&P 500 Five-Factor DuPont ROE Attribution: Operating Margin vs Tax & Leverage DriversInstitutional Earnings Capex Macro
Russell 2000 Floating SOFR Debt Wall vs S&P 500 Fixed Coupons: Small-Cap Earnings CompressionInstitutional Earnings Capex Macro
Corporate Cash Conversion Cycle (DSO, DIO, DPO): Working Capital Forensics & ASC 405-50 DebtInstitutional Earnings Capex Macro
DXY Dollar Strength & S&P 500 Foreign Revenue: FX Translation vs ASC 815 Cash-Flow Hedging
AlphaPulse Finance Data, Benchmarks & Contributor Records
CC BY 4.0 Open Data
Open Institutional Datasets (CSV / JSON) →
Download desk-compiled quantitative series & schemas.
2026 Reference Matrix
2026 Institutional Benchmarks & Thresholds →
Statutory capital, clearing, margin & rate conventions.
Editorial Records
Authors & Review Records →
View named contributors where those records are available.
Complete Index
Master Research & Dossier Archive →
Browse all published briefings by topic pillar & date.