
Inflation Breakevens Real Rates
Employment Cost Index (ECI) vs Average Hourly Earnings & Atlanta Fed Wage Tracker
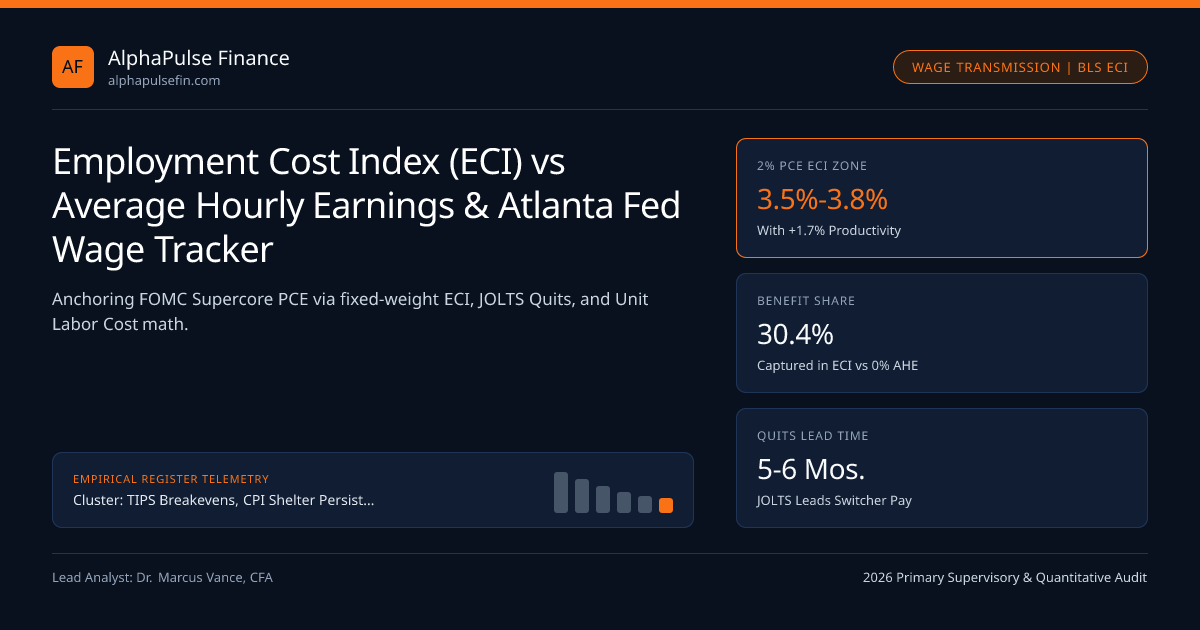
Holding occupation and industry weights fixed while capturing non-wage health and bonus benefits (~30% of labor cost), quarterly BLS Employment Cost Index (ECI) avoids Average Hourly Earnings mix traps and anchors FOMC Supercore PCE.
In April 2020—during the worst single month of job losses since the Great Depression—monthly Average Hourly Earnings (AHE) inside the Nonfarm Payrolls report bizarrely skyrocketed +4.7% in a single month (+7.9% YoY)! Did employers hand out massive raises in lockdown? Of course not: 14 million low-wage restaurant and hospitality workers lost their jobs overnight, mechanically spiking the average wage of remaining high-paid software and finance workers! That composition-bias fiasco explains why the Federal Reserve treats the quarterly BLS Employment Cost Index (ECI) and longitudinal Atlanta Fed Wage Growth Tracker as its gold-standard labor-cost anchors for BEA Core PCE and FOMC Corridor calibration.
Three Structural Reasons Quarterly ECI Crushes Monthly Payroll AHE#
Published on the final business day of January, April, July, and October (8:30 AM ET—often right before FOMC meetings, famously forcing Chair Powell's November/December 2021 hawkish pivot!), BLS ECI eliminates every flaw of monthly Establishment Survey AHE:
- Laspeyres Fixed Occupation-by-Industry Weighting: Just like CPI prices a fixed basket of goods, ECI prices a fixed grid of specific jobs (e.g., ICU Registered Nurse in Midwest Hospitals, Senior Cloud Engineer in Info Tech)—completely immune to compositional shifts when seasonal retail or leisure hiring surges!
- Includes Non-Wage Employee Benefits (~30.4% of Total Compensation!): AHE measures only gross hourly cash pay (ignoring healthcare insurance premiums, 401(k) matches, paid leave, and non-production bonuses!). ECI captures 100% of total employer labor cost!
- Tracks Incentive-Pay Occupations Cleanly: Isolating ECI Private Wages & Salaries Excluding Incentive-Paid Occupations (stripping volatile real-estate/auto/Wall Street commissions!) gives the FOMC its cleanest reading of sticky underlying wage inertia.
Atlanta Fed Job-Switcher vs Job-Stayer Spread & Quit-Rate Elasticity#
Because ECI prints only four times a year with a 30-day lag, rates desks supplement ECI monthly with the Atlanta Fed Wage Growth Tracker—which matches the exact same individual household worker across Current Population Survey (CPS) interviews 12 months apart and takes the median (zero composition or billionaire-outlier bias!):
- The "Job-Switcher Premium" (Switchers minus Stayers): In the overheating 2022 labor market (JOLTS Private Quits Rate = 3.3%), workers switching employers captured +7.8% median raises vs +5.3% for job stayers (+250 bps switcher premium!), forcing employers to hike retention pay across the board.
- 2025-2026 Normalization (JOLTS Quits < 2.0%): Once hiring froze into a "low-hire, low-fire" equilibrium, the Job-Switcher minus Job-Stayer spread collapsed back below +45 bps—leading ECI Private Wages smoothly down toward the 3.5% FOMC comfort zone traded by STIR desks at Cantor Fitzgerald and CFTC CME venues!
- SteadyStateFOMCCompatibleECI = 2.00%PCETarget + TrendLaborProductivity_Growth (1.65%) = 3.65% YoY!
- Worked 2020 Lockdown AHE Mix-Bias Proof (Why Fixed-Weight ECI Saved Analysts From Error):
- Pre-Shock: 80 High-Skill Workers @ $45/hr + 20 Leisure Workers @ $15/hr -> Mean AHE = ($3,600 + $300) / 100 = $39.00/hr
- Shock: 0% raises for anyone, but 15 Leisure Workers laid off -> Mean AHE = ($3,600 + $75) / 85 = $43.24/hr (+10.9% FAKE SURGE!)
- Fixed-Weight ECI Result (holding 80/20 weights constant on unchanged wages): +0.00% exact!
Unit Labor Cost Identity: Why 3.5%-3.8% Wage Growth Equals 2.0% PCE Inflation!#
Hawks frequently panic whenever nominal wages grow at 3.6% YoY, falsely assuming 3.6% wages mean 3.6% inflation! Macro accounting proves Unit Labor Cost (ULC = ECI Hourly Compensation Growth minus Nonfarm Labor Productivity Growth)—NOT raw nominal wages—governs corporate price pass-through!
US Wage & Labor-Cost Benchmark Comparison Matrix (Q4 2026)#
Notice the Productivity Offset: if AI and capital deepening sustain 1.6% to 1.8% trend Nonfarm Business Productivity growth, then 3.6% to 3.8% ECI compensation growth generates EXACTLY 2.0% Unit Labor Cost growth—100% consistent with 2.0% PCE inflation and steady corporate profit shares!
| US Wage / Cost Indicator | Agency & Frequency | Composition-Adjusted? | Includes 30% Benefits? | Best Analytical Role |
|---|---|---|---|---|
Employment Cost Index (ECI) | BLS (Quarterly) | Yes (Fixed Job Grid) | YES (Health + 401k + Bonus) | Definitive FOMC wage-push benchmark |
| Atlanta Fed Wage Tracker | Atlanta Fed (Monthly) | Yes (Same Worker t-12) | No (Cash Hourly/Salary) | Real-time Switcher vs Stayer lead |
Average Hourly Earnings (AHE) | BLS NFP (Monthly) | NO (Mix-Distorted!) | No (Cash Pay Only) | Fast First-Friday check; fade mix spikes! |
Nonfarm Unit Labor Costs (ULC) | BLS (Quarterly) | Aggregate Output/Hour | YES (Full NIPA Comp) | Links wages to S&P 500 profit margins |
Trading ECI Release Mornings Against Supercore PCE & Front-End OIS#
Quarterly ECI mornings (8:30 AM ET end of Jan/Apr/Jul/Oct, released simultaneously with monthly BEA PCE!) produce some of the highest 5-minute hit-rate moves in 2-Year Treasury Notes and CME SR3 Red SOFR Packs: a +/-0.20% QoQ surprise in Private ECI (~80 bps annualized!) moves 2-year OIS yields an average +/-7.8 bps within 15 minutes, overpowering noisy backward-looking monthly PCE revisions.
Desk replication notes span TIPS Breakevens, CPI Shelter Persistence & Forward Real Rates, Gold Spot Divergence From 10-Year TIPS Real Yields, and BEA Core PCE vs BLS Core CPI Wedge, organized across TIPS Breakevens and verification registry.
Frequently asked questions
Why did a single October 2021 Employment Cost Index (ECI) print famously force the Fed to retire "Transitory"?
At his November 2021 press conference, Chair Powell revealed that seeing Q3 2021 ECI surge +1.3% in a single quarter (+5.3% annualized) the Friday before the FOMC meeting convinced him inflation had spread into structural wages, triggering accelerated tapering!
Why should analysts check "ECI Private Wages Excluding Incentive-Paid Occupations"?
Commission-paid workers (residential realtors, mortgage loan officers, car salespeople, securities brokers) swing +12% to -8% with interest rates; stripping incentive occupations reveals smooth underlying base-pay momentum.
What is the "Top-Coding" limitation inside the Atlanta Fed Wage Growth Tracker?
Because Census Current Population Survey (CPS) household micro-data top-codes high earners (~$150K+ annualized) for privacy, the Atlanta Fed excludes top-coded individuals—making its median cleanest for the middle 80% of the workforce.
Can rising wages ever coincide with FALLING inflation?
Yes—productivity booms! During 1996-1999 and 2023-2024, surging output per hour (+2.5% to +3.0% productivity) allowed workers to enjoy +4.0% real-purchasing-power wage gains while Unit Labor Costs cooled below 2.0%!
Publication record
- Published
- November 13, 2026
- Updated
- November 14, 2026
- Author
- Dr. Marcus Vance, CFA
- Review
- Review not recorded
- Automated fact check
- Passed in the stored pipeline record
- Source URLs
- 3 recorded
AI assistance recorded: anthropic/claude-opus-4.6. This field does not establish human review or source verification.
Academic & Institutional Attribution
Cite This Research & Embed Live Data Card
Standard academic & institutional research paper citation format.
Dr. Marcus Vance, CFA. (2026, November 14). Employment Cost Index (ECI) vs Average Hourly Earnings & Atlanta Fed Wage Tracker. AlphaPulse Finance. https://alphapulsefin.com/analysis/employment-cost-index-eci-atlanta-fed-wage-tracker-supercoreRelated Inflation Breakevens Real Rates & Institutional Briefings
Explore Inflation Breakevens Real Rates Hub (20) →Inflation Breakevens Real Rates
TIPS Breakevens, CPI Shelter Persistence & Forward Real Rates: Institutional GuideInflation Breakevens Real Rates
Gold Spot Divergence From 10-Year TIPS Real Yields: EM Central Bank Reserve ReallocationInflation Breakevens Real Rates
TIPS Asset-Swap & Iota Spreads: Cash Breakeven vs Zero-Coupon Inflation Swap ArbitrageInflation Breakevens Real Rates
University of Michigan vs NY Fed SCE Inflation Expectations: Partisan Skew & Salience BiasInflation Breakevens Real Rates
Real 2s10s TIPS Yield Curve Slope: Auditing Ex-Ante FOMC Monetary RestrictivenessInflation Breakevens Real Rates
5y5y Forward Inflation Swaps vs TIPS Breakevens: Stripping Out Oil & Liquidity NoiseInflation Breakevens Real Rates
BLS CPI Shelter Persistence: 6-Month OER Panel Rotation vs New-Tenant Repeat Rent LagsInflation Breakevens Real Rates
BEA Core PCE vs BLS Core CPI Wedge: Scope, Weight & Fisher Substitution DecompositionInstitutional Earnings Capex Macro
Debt-Funded M&A Accretion Hurdle Rates vs Share Buyback IRR: Exposing the EPS Accretion FallacyInstitutional Earnings Capex Macro
Earnings-Day Single-Stock Implied Straddles & S&P 500 Dispersion Volatility MechanicsInstitutional Earnings Capex Macro
ASC 715 Corporate Pension Surpluses & Pension Risk Transfer (PRT) Buyouts: Industrial EPS QualityInstitutional Earnings Capex Macro
Nominal GDP Deceleration & S&P 500 Margins: Decomposing Price/Mix vs Real Unit Volume Leverage
AlphaPulse Finance Data, Benchmarks & Contributor Records
CC BY 4.0 Open Data
Open Institutional Datasets (CSV / JSON) →
Download desk-compiled quantitative series & schemas.
2026 Reference Matrix
2026 Institutional Benchmarks & Thresholds →
Statutory capital, clearing, margin & rate conventions.
Editorial Records
Authors & Review Records →
View named contributors where those records are available.
Complete Index
Master Research & Dossier Archive →
Browse all published briefings by topic pillar & date.