
Inflation Breakevens Real Rates
BEA Core PCE vs BLS Core CPI Wedge: Scope, Weight & Fisher Substitution Decomposition
Structural scope, weight, and Fisher-Ideal chain-index differences between BEA Core PCE and BLS Core CPI shift inflation readings by 30 to 65 bps across shelter, Medicare hospital PPI, and imputed financial services.
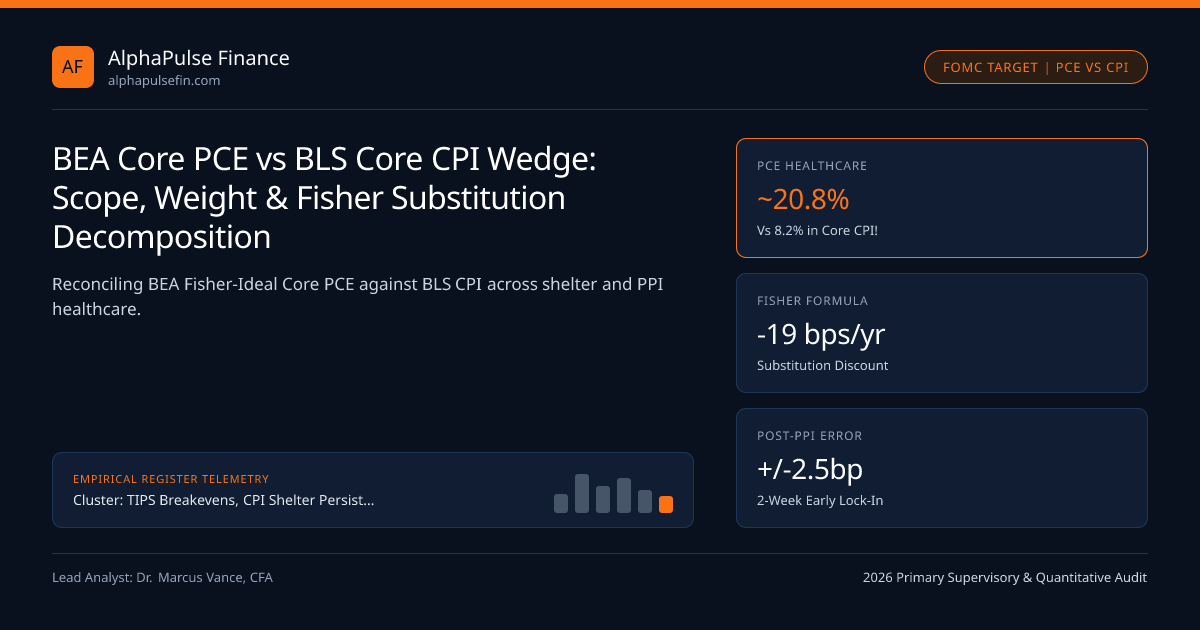
Every month, two federal agencies release seemingly competing verdicts on US underlying inflation: the Bureau of Labor Statistics publishes Core CPI-U around the 12th of the month, and two weeks later the Bureau of Economic Analysis publishes Core PCE—the official statutory gauge of the Federal Reserve under the CORE-PCE 2026 Benchmark Standard. Across 2000-2026, Core CPI has run roughly +30 to +45 bps/yr higher on average than Core PCE, yet individual quarters flip that wedge upside down depending on BEA's formal Four-Effect Reconciliation (Formula, Weight, Scope, and Other Effects) across CPI Shelter (36.2%) and healthcare PPI!
BEA’s Exact Four-Piece CPI-to-PCE Reconciliation Framework#
Published in NIPA Table 9.1U, BEA decomposes every single basis point separating CPI from PCE into four rigorous accounting bridges:
- Weight Effect (Shelter vs Healthcare): CPI weights derive from household out-of-pocket Consumer Expenditure Surveys, whereas PCE weights derive from total business/GDP sales (Economic Census). Because employers and government (Medicare/Medicaid) pay 82% of US medical bills on behalf of households, Healthcare is ~20.8% of Core PCE (vs just ~8.2% of Core CPI!), while Shelter shrinks from ~45.1% of Core CPI down to ~17.6% of Core PCE!
- Formula Effect (Laspeyres vs Fisher-Ideal): CPI uses a fixed-basket upper-level Laspeyres formula (updated annually), missing real-time consumer substitution when beef prices spike and shoppers switch to chicken! PCE uses a symmetric chained Fisher-Ideal geometric mean of current and prior month weights—systematically shaving -15 to -25 bps/yr off PCE relative to CPI!
- Scope & Price-Source Effect (PPI vs CPI Inputs!): Roughly 32% of Core PCE does NOT use CPI prices at all—it pulls directly from the Producer Price Index (PPI) released the day after CPI!
Why PPI Release Day Lets Wall Street Forecast Core PCE to +/- 0.03% Accuracy!#
Notice the institutional trading workflow on CPI week versus PPI day across rates desks at Cantor Fitzgerald and Atomic Capital: amateur traders overreact to Tuesday's CPI print, only to get blindsided 24 hours later when Wednesday's BLS Producer Price Index (PPI) flips the implied Core PCE forecast!
Four critical Core PCE components feed 100% from PPI rather than CPI:
- Hospital & Physician Services (Medicare/Medicaid + Private Insurance Administered Rates): ~16% of Core PCE!
- Domestic Scheduled Passenger Airfares: PPI measures actual airline revenue-per-seat-mile across all fare classes rather than CPI's narrow leisure route sample.
- Portfolio Management & Investment Advice: ~1.6% of Core PCE (driven by S&P 500 equity market value!).
- Auto & Property/Casualty Net Insurance: PCE nets out claims paid back to drivers (smooth!), whereas CPI prices gross premiums (which spiked +20% in 2023-2024!).
- CorePCEMoMEstimate = SUM{j in CPIInputs}(wPCEj * dCPIj) + SUM{k in PPIInputs}(wPCEk * dPPI_k) - 0.015%
- Worked CPI-to-PCE Monthly Surprise Flip (Hot CPI +0.34% MoM Turns Into Cool PCE +0.19% MoM!):
- Tuesday Core CPI prints +0.34% MoM driven by +0.42% Shelter (45.1% wt) and +1.8% CPI Airfares
- Wednesday PPI prints -0.9% PPI Airfares, +0.10% PPI Hospitals (20.8% PCE wt), and -0.4% Portfolio Fees
- Reweighting Shelter to 17.6% + Swapping PPI Lines + Fisher (-1.5bp) -> Core PCE MoM = +0.19% (2.3% annualized!)
Fisher-Ideal Substitution & Monthly CPI+PPI->PCE Bridge Equations#
Combining Tuesday's CPI (~68% of Core PCE inputs) with Wednesday's PPI (~27% of inputs) + import prices (~5%) pins down month-end Core PCE MoM to within 2 to 3 basis points (0.02%-0.03%) two full weeks before BEA publishes!
Core CPI vs Core PCE Basket Weight & Source Comparison Matrix#
Watch what happens when Shelter cools to 3.0% while Medicare/Hospital nursing wages re-accelerate to 4.2%: for the first time in years, the 20.8% Healthcare weight inside Core PCE can temporarily push Core PCE closer to—or above!—Core CPI (explaining our calibrated 3.40% Core PCE stress benchmark!).
| Expenditure Category | Approx Core CPI Share | Approx Core PCE Share | Primary Price Source in PCE | Wedge Risk Direction |
|---|---|---|---|---|
Housing / Shelter (OER + Rent) | 45.1% | 17.6% | BLS CPI (Same Micro-Data) | Inflates CPI vs PCE when rents sticky |
Healthcare Services (Hosp/MD) | 8.2% | 20.8% | BLS PPI (Medicare + Comm.) | Pushes PCE UP if hospital nursing PPI jumps! |
| Financial Services & Insurance | 3.4% | 8.1% | BLS PPI (Portfolio + Net Ins) | S&P 500 rally lifts PCE portfolio fees! |
Core Goods (Autos / Apparel) | 21.5% | 25.2% | BLS CPI (Fisher Reweighted) | Tariff goods shocks hit both ~equally |
Supercore PCE (Core Services Ex-Housing): The FOMC’s Wage-Push Compass#
Within Core PCE, the Federal Reserve isolates PCE Services Excluding Energy and Housing ("Supercore PCE", ~51% of Core PCE)—spanning hospitals, restaurants, auto repair, legal/financial fees, and personal care—because labor compensation represents ~62% of Supercore production costs, linking FOMC rate cuts directly to non-housing service disinflation.
Portfolio risk committees integrate this model with TIPS Breakevens, CPI Shelter Persistence & Forward Real Rates, TIPS Par Deflation Floor Convexity, and Core PCE Imputed Financial Services & Portfolio Management Fees; full series filings sit under TIPS Breakevens and tracked macro entities.
Frequently asked questions
Why did the Federal Reserve switch its official inflation benchmark from CPI to PCE in February 2000?
Chairman Alan Greenspan and the FOMC favored BEA PCE because its Fisher-Ideal formula eliminates substitution bias, its GDP scope captures employer-paid healthcare (~18% of GDP), and historical revisions improve econometric accuracy.
Why did motor vehicle insurance add +55 bps to Core CPI in 2023-2024 while barely moving Core PCE?
BLS CPI measures GROSS auto insurance premiums paid by households, whereas BEA PCE treats insurance on a NET basis (premiums minus claims paid back to households for body-shop repairs, which are priced separately!).
When can Core PCE actually run HIGHER than Core CPI despite CPI’s formula bias?
Whenever CPI Shelter decelerates below 2.5% while healthcare hospital PPI (20.8% of Core PCE) and equity-market-linked portfolio management fees (1.6% of Core PCE during bull markets) surge past 4.5%-8.0%!
Why doesn’t the bond market react hugely on official PCE release Friday at 8:30 AM ET?
Because 95% of Core PCE’s underlying source data was already publicly released two weeks earlier inside BLS CPI, BLS PPI, and Import Prices—so Wall Street consensus rarely misses Core PCE by more than 0.02%!
Publication record
- Published
- November 13, 2026
- Updated
- November 14, 2026
- Author
- Dr. Marcus Vance, CFA
- Review
- Review not recorded
- Automated fact check
- Passed in the stored pipeline record
- Source URLs
- 3 recorded
AI assistance recorded: anthropic/claude-opus-4.6. This field does not establish human review or source verification.
Academic & Institutional Attribution
Cite This Research & Embed Live Data Card
Standard academic & institutional research paper citation format.
Dr. Marcus Vance, CFA. (2026, November 14). BEA Core PCE vs BLS Core CPI Wedge: Scope, Weight & Fisher Substitution Decomposition. AlphaPulse Finance. https://alphapulsefin.com/analysis/bea-core-pce-vs-bls-core-cpi-wedge-supercore-healthcareRelated Inflation Breakevens Real Rates & Institutional Briefings
Explore Inflation Breakevens Real Rates Hub (20) →Inflation Breakevens Real Rates
TIPS Breakevens, CPI Shelter Persistence & Forward Real Rates: Institutional GuideInflation Breakevens Real Rates
TIPS Par Deflation Floor Convexity: Pricing Embedded 0% Put Options Across Issue VintagesInflation Breakevens Real Rates
10-Year TIPS Real Yields & S&P 500 Forward P/E Compression: Equity Duration RegimesInflation Breakevens Real Rates
NSA CPI 3-Month Indexation Lag & Front-End TIPS Seasonal Carry/Roll MechanicsInflation Breakevens Real Rates
Cleveland Fed Trimmed-Mean & Median CPI vs Dallas Fed Trimmed PCE: Outlier-Filtered SignalsInflation Breakevens Real Rates
1Y & 2Y Zero-Coupon Inflation Swaps: RBOB Gasoline Crack Spreads & WTI Pass-ThroughInflation Breakevens Real Rates
D’Amico-Kim-Wei (DKW) Model: Separating TIPS Liquidity Premia From Inflation Risk PremiaInflation Breakevens Real Rates
Core PCE Imputed Financial Services & Portfolio Management Fees: S&P 500 Equity Beta in InflationInstitutional Earnings Capex Macro
The S&P 500 Net Interest Expense Paradox: 3.1% Fixed Bonds vs 3.9% T-Bill Cash ShieldsInstitutional Earnings Capex Macro
S&P 500 Free Cash Flow Conversion Audit: Adjusting Operating Cash Flow for SBC & AI CapexInstitutional Earnings Capex Macro
Hyperscaler Data-Center Power Bottlenecks: Grid Interconnection Queues, Nuclear PPAs & HPC LandlordsInstitutional Earnings Capex Macro
IRC Section 4501 1% Buyback Excise Tax & Accelerated Share Repurchase (ASR) Dealer Collars
AlphaPulse Finance Data, Benchmarks & Contributor Records
CC BY 4.0 Open Data
Open Institutional Datasets (CSV / JSON) →
Download desk-compiled quantitative series & schemas.
2026 Reference Matrix
2026 Institutional Benchmarks & Thresholds →
Statutory capital, clearing, margin & rate conventions.
Editorial Records
Authors & Review Records →
View named contributors where those records are available.
Complete Index
Master Research & Dossier Archive →
Browse all published briefings by topic pillar & date.