
Inflation Breakevens Real Rates
Zero-Coupon vs Year-on-Year Inflation Caps & Floors: Tail Volatility Smiles & Regime Probabilities
OTC US CPI inflation caps (struck at 3.5%-5.0%) and deflation floors (struck at 0.0%-1.0%) exhibit a pronounced U-shaped volatility smile that reveals live risk-neutral probabilities of tail deflation versus runaway inflation.
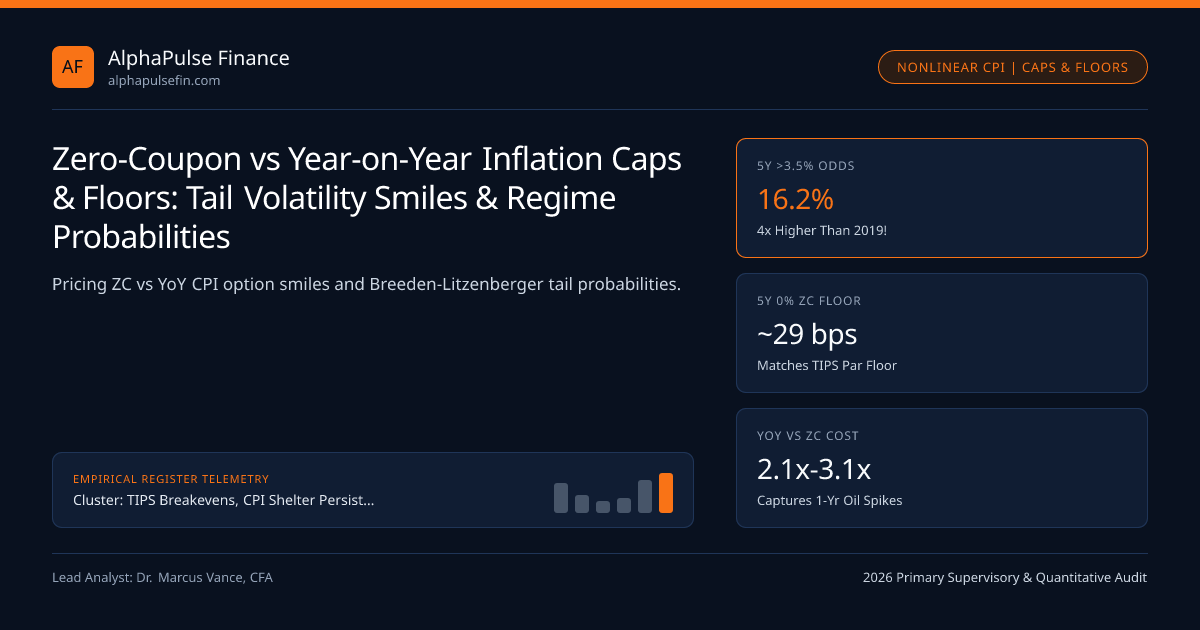
Linear swaps (5y5y ZCIS at 259 bps) and cash 10-Year TIPS (1.98% Real) tell you only the mean of the market's inflation distribution: an average of 2.5% could reflect a calm 100% certainty of 2.5%, OR a bimodal nightmare of 50% probability of -1.0% depression deflation + 50% probability of +6.0% stagflation! To map the entire Risk-Neutral Probability Density Function (PDF) watched by the Minneapolis and New York Federal Reserve ahead of FOMC Corridor decisions, volatility desks price OTC Zero-Coupon (ZC) and Year-on-Year (YoY) US CPI Caps and Floors across CFTC-supervised dealer books.
Zero-Coupon Compounded Caps vs Year-on-Year Strip Caps: Path Dependence!#
Inflation nonlinear derivatives trade in two distinct structural formats across inter-dealer brokers such as Cantor Fitzgerald and institutional swap desks:
- Zero-Coupon (ZC) Inflation Cap / Floor (Single Compounded Payoff at Maturity T): A 5-Year 4.00% ZC Cap pays Notional * max( 0 , (RefCPI5 / RefCPI0) - (1.0400)^5 ) at Year 5 (requires cumulative 5-year CPI to beat +21.67%!). Notice that ZC Floors struck at 0.00% (paying max(0, 1 - CPIT/CPI0)) match the exact embedded par deflation floor inside newly issued US TIPS!
- Year-on-Year (YoY) Inflation Cap / Floor (Annual Caplet Strip): Pays max(0, YoYCPIt - K) separately at the end of EVERY single year t = 1..5! Because one single spike year of +5.5% CPI followed by four years of +1.5% CPI (average 2.3%) pays off handsomely in Year 1 on a YoY 4% Cap while paying $0.00 on a 5-Year 4% ZC Cap, YoY Caps are ALWAYS significantly more expensive than matched-strike ZC Caps (depending on year-to-year CPI autocorrelation!)!
Breeden-Litzenberger Tail Extraction: Reading the U-Shaped CPI Volatility Smile#
Applying Breeden and Litzenberger's (1978) second-derivative option theorem (d^2Call / dK^2) across 5-Year ZC Floor strikes (-1%, 0%, 1%, 2%) and Cap strikes (3%, 4%, 5%) produces the live Market-Implied 5-Year Inflation Probability Distribution published by the Federal Reserve Bank of Minneapolis:
- 2015-2020 Skew (Heavy Left-Tail Deflation Skew): 0% and 1% CPI Floors traded at 145 bps normal vol while 4% Caps traded cheap at 78 bps vol—pricing a 24% probability of <1% 5-year CPI and only a 4% probability of >3.5% CPI!
- 2022-2026 Symmetric / Right-Wing Smile: Post-2022 inflation trauma permanently repriced 3.5% and 4.0% CPI Caps up to 118-135 bps implied vol! In Q4 2026, 5-year CPI options price a ~16% risk-neutral probability of 5-year CPI averaging >3.50% alongside an ~11% probability of <1.25%—explaining why positive Inflation Risk Premia (+36 bps DKW) persist even with spot CPI near target!
- RiskNeutralPDF(K) = (1 / P(0, T)) * [ d^2FloorPrice(K) / d_G^2 ] where G = (1 + K)^T - 1
- Worked 5-Year 4.00% Zero-Coupon Cap vs YoY Caplet Strip Under a 1-Year Tariff/Oil Spike:
- Path: Year 1 CPI = +5.80%, Years 2..5 CPI = +2.10% each -> Cumulative 5Y = 1.058 * (1.021)^4 = 1.1497 (+14.97% < 21.67% 4% hurdle!)
- 5-Year 4.00% Zero-Coupon Cap Payout at T=5: max(0, 1.1497 - 1.2167) = $0.00 (Zero payout!)
- 5-Year 4.00% Year-on-Year Cap Payout in Year 1: max(0, 5.80% - 4.00%) = +180 bps PAID IN CASH AT YEAR 1!
Zero-Coupon Cap/Floor Payoff & Forward CPI Autocorrelation Convexity Equations#
Notice a subtle forward-starting convexity adjustment on YoY Swaps & Caplets: because each annual YoY ratio CPIt / CPI{t-1} divides by a stochastic denominator CPI_{t-1} correlated with nominal discount factors, pricing YoY strips off ZCIS requires the Jarrow-Yildirim (2003) Foreign-Exchange-Analogy Volatility Adjustment!
5-Year US CPI Option Volatility Smile & Implied Regime Probabilities (Q4 2026)#
Real-money endowments, corporate pensions with capped 0% Floor / 3% Cap LPI (Limited Price Indexation) COLAs, and macro hedge funds drive two-way liquidity across the smile.
| Inflation Option Structure | Payoff Formula | Sensitivity to CPI Autocorrelation | Natural Institutional End-User | Typical Upfront Cost (5Y) |
|---|---|---|---|---|
Zero-Coupon 0.0% Floor | max(0, 1 - CPI_5/CPI_0) | High (Requires 5Y Cumulative Drop) | TIPS Arbitrageurs (Strips TIPS Put) | ~26 - 32 bps Upfront |
Zero-Coupon 4.0% Cap | max(0, CPI_5/CPI_0 - 1.04^5) | High (Trends Amplify ZC Vega!) | Sovereign / Macro Stagflation Pods | ~42 - 52 bps Upfront |
Year-on-Year 3.5% Cap | SUM_{t=1..5} max(0, YoY_t - 3.5%) | Negative (Mean-Reversion Helps!) | Capped-COLA Pensions & Real Estate | ~165 - 195 bps Upfront |
Dual-Digital CPI>3.5 & SPX<-15 | Fixed 100bp if Both Hit | Cross-Asset Stock-CPI Correlation | 60/40 Multi-Asset Tail Overlay (CFTC) | ~45% Cheaper Than Vanilla |
Structuring Zero-Cost CPI Collars & Stagflation Hybrid Dual-Digitals#
Multi-asset desks regulated by the CFTC and SEC structure two high-efficiency tail overlays using inflation options:
- Pension LPI Collar (Long 0% Floor / Short 3.5% Cap): Public pensions whose retiree COLAs are legally capped at 3.0%-3.5%/yr sell the rich 3.5% CPI Cap to completely fund their 0% deflation floor!
- Hybrid Stagflation Dual-Digital (5Y CPI > 3.5% AND S&P 500 < -15%): Because positive stock-bond correlation makes stagflation the worst portfolio regime, correlation desks price hybrid digitals at a 45% discount to standalone CPI caps!
Downstream transmission channels are modeled in Employment Cost Index (ECI) vs Average and BLS CPI Shelter Persistence, synthesized in TIPS Breakevens, CPI Shelter Persistence & Forward Real Rates and cataloged at TIPS Breakevens (institutional datasets).
Frequently asked questions
How does the Jarrow-Yildirim (2003) inflation option model work intuitively?
Jarrow and Yildirim modeled Nominal Rates as "domestic interest rates," Real TIPS Rates as "foreign interest rates," and the Consumer Price Index as the "spot FX exchange rate" converting real purchasing power into nominal dollars!
Why does positive year-to-year CPI autocorrelation make Zero-Coupon Caps MORE expensive relative to YoY Caps?
If high inflation in Year 1 strongly predicts high inflation in Years 2-5 (persistent 1970s regime), multi-year cumulative variance explodes faster than 5 * sigma_1Y^2, driving compounded ZC Cap volatility sharply higher!
Where can researchers view free public option-implied US inflation tail probabilities?
The Federal Reserve Bank of Minneapolis publishes Market-Based Probabilities of Deflation and High Inflation (derived directly from dealer USD CPI Cap and Floor quotes) in its regular Market-Based Inflation Dashboard!
Why are UK and Eurozone inflation option markets historically larger than USD CPI options?
UK DB pension statutes legally mandate "Limited Price Indexation" (LPI: pension benefits grow at RPI/CPI floored at 0% and capped at 3% or 5%), generating hundreds of billions of natural corporate LPI collar hedging!
Publication record
- Published
- November 13, 2026
- Updated
- November 14, 2026
- Author
- Dr. Marcus Vance, CFA
- Review
- Review not recorded
- Automated fact check
- Passed in the stored pipeline record
- Source URLs
- 3 recorded
AI assistance recorded: anthropic/claude-opus-4.6. This field does not establish human review or source verification.
Academic & Institutional Attribution
Cite This Research & Embed Live Data Card
Standard academic & institutional research paper citation format.
Dr. Marcus Vance, CFA. (2026, November 14). Zero-Coupon vs Year-on-Year Inflation Caps & Floors: Tail Volatility Smiles & Regime Probabilities. AlphaPulse Finance. https://alphapulsefin.com/analysis/zero-coupon-inflation-caps-floors-volatility-smile-tail-pricingRelated Inflation Breakevens Real Rates & Institutional Briefings
Explore Inflation Breakevens Real Rates Hub (20) →Inflation Breakevens Real Rates
TIPS Breakevens, CPI Shelter Persistence & Forward Real Rates: Institutional GuideInflation Breakevens Real Rates
Employment Cost Index (ECI) vs Average Hourly Earnings & Atlanta Fed Wage TrackerInflation Breakevens Real Rates
Gold Spot Divergence From 10-Year TIPS Real Yields: EM Central Bank Reserve ReallocationInflation Breakevens Real Rates
TIPS Asset-Swap & Iota Spreads: Cash Breakeven vs Zero-Coupon Inflation Swap ArbitrageInflation Breakevens Real Rates
University of Michigan vs NY Fed SCE Inflation Expectations: Partisan Skew & Salience BiasInflation Breakevens Real Rates
Real 2s10s TIPS Yield Curve Slope: Auditing Ex-Ante FOMC Monetary RestrictivenessInflation Breakevens Real Rates
5y5y Forward Inflation Swaps vs TIPS Breakevens: Stripping Out Oil & Liquidity NoiseInflation Breakevens Real Rates
BLS CPI Shelter Persistence: 6-Month OER Panel Rotation vs New-Tenant Repeat Rent LagsInstitutional Earnings Capex Macro
Implied S&P 500 Equity Risk Premium: Cash-Payout FCF Yield vs 10-Year TIPS Real YieldsInstitutional Earnings Capex Macro
Debt-Funded M&A Accretion Hurdle Rates vs Share Buyback IRR: Exposing the EPS Accretion FallacyInstitutional Earnings Capex Macro
Earnings-Day Single-Stock Implied Straddles & S&P 500 Dispersion Volatility MechanicsInstitutional Earnings Capex Macro
ASC 715 Corporate Pension Surpluses & Pension Risk Transfer (PRT) Buyouts: Industrial EPS Quality
AlphaPulse Finance Data, Benchmarks & Contributor Records
CC BY 4.0 Open Data
Open Institutional Datasets (CSV / JSON) →
Download desk-compiled quantitative series & schemas.
2026 Reference Matrix
2026 Institutional Benchmarks & Thresholds →
Statutory capital, clearing, margin & rate conventions.
Editorial Records
Authors & Review Records →
View named contributors where those records are available.
Complete Index
Master Research & Dossier Archive →
Browse all published briefings by topic pillar & date.