
Holston-Laubach-Williams vs Lubik-Matthes Neutral Rate (r*) Estimation in US Rates
Divergence of 133 bps between NY Fed Holston-Laubach-Williams (+0.82%) and Richmond Fed Lubik-Matthes (+2.15%) real neutral rate estimates frames the macro debate over FOMC policy restrictiveness.
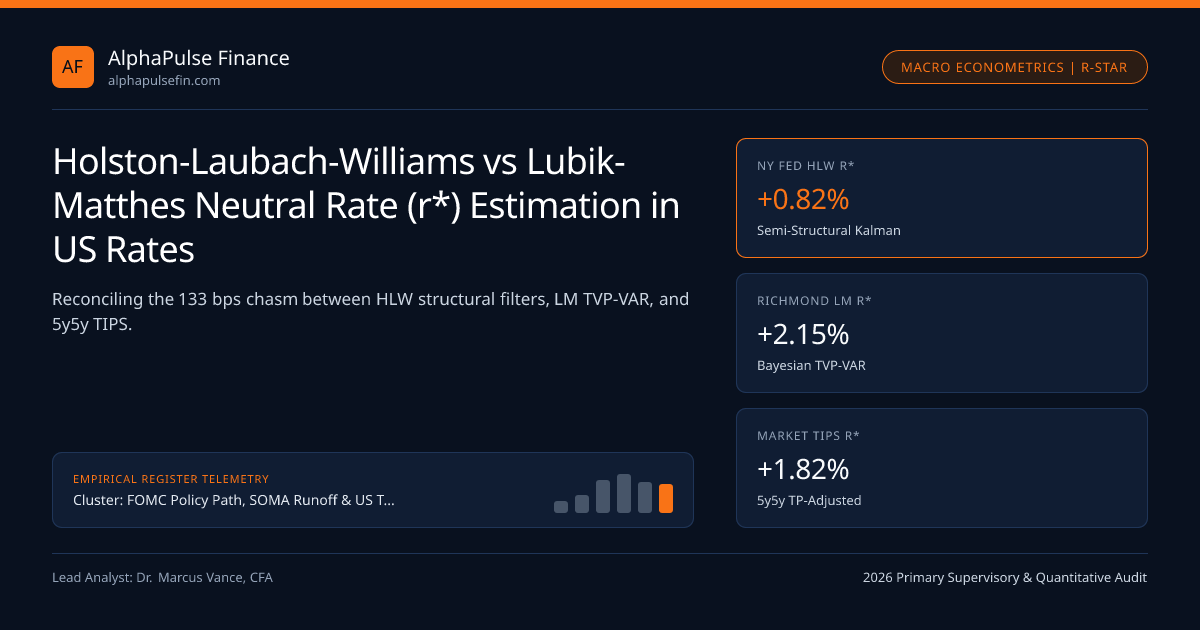
Whether an FOMC 3.75%-4.00% Target Corridor actively slows US aggregate demand or merely sits near equilibrium depends entirely on the unobserved real neutral interest rate, r*. Across the Federal Reserve System research network in late 2026, official econometric trackers disagree by 133 bps: the New York Fed Holston-Laubach-Williams (HLW) semi-structural model places real r* near +0.82%, whereas the Richmond Fed Lubik-Matthes (LM) time-varying parameter vector autoregression (TVP-VAR) estimates +2.15%—closely matching the 1.98% spot real yield on the 10-Year US TIPS Curve.
IS-Curve Slope Fragility in Holston-Laubach-Williams vs Agnostic TVP-VAR#
Holston, Laubach, and Williams (2017, updated 2023 with COVID-19 outlier variance scaling) specify a New Keynesian state-space system linking the output gap to real short-rate gaps (IS curve) and core inflation to the output gap (Phillips curve), decomposing r* = c * g + z, where g is trend potential GDP growth and z captures non-growth savings/investment shifts. When the US economy expanded at 2.7%-3.0% real GDP during 2023-2025 despite 5.25%-5.50% nominal policy rates, HLW attributed resilience mostly to positive transitory demand shocks and supply healing rather than raising z, keeping r* below 1.0%.
Lubik and Matthes (2015) avoid imposing theoretical IS or Phillips curve elasticities altogether. Their three-variable Bayesian TVP-VAR over real GDP growth, PCE inflation, and real short rates defines r* as the five-year-ahead conditional forecast of the real federal funds rate. Because real rates stayed near +1.8% to +2.3% without triggering recessionary output contraction, the Bayesian posterior rapidly updated r* above +2.10%.
Market-Implied Forward Real Rates (5y5y TIPS) vs Econometric Filters#
Fixed-income portfolio managers at firms like Alpine Woods and primary dealer desks at Cantor Fitzgerald compare central bank econometric trackers against 5-year, 5-year forward TIPS real yields (~2.12% in Q4 2026). Even after subtracting an estimated 25-to-35 bps real term premium using the D'Amico-Kim-Wei (DKW) model, market pricing implies an equilibrium real short rate of +1.75% to +1.85%—nearly 100 bps above HLW.
If true r* sits at +1.80% rather than +0.82%, then an EFFR median of 3.88% against 2.45% one-year forward inflation delivers an ex-ante real rate of +1.43%—meaning monetary policy would already be mildly accommodative rather than restrictive, explaining robust S&P 500 capex and tight credit spreads monitored by the SEC and FINRA.
- Ex-Ante Real Short Rate: rrealt = EFFRt - Et[pi_{t,t+4Q}]
- PolicyStanceGapbps = (rrealt - r*t) * 100
- Worked Policy Stance Contrast (EFFR = 3.88%, 1Y Expected Core PCE = 2.40% -> r_real = +1.48%):
- Under HLW (r* = +0.82%): Gap = (1.48% - 0.82%) * 100 = +66 bps (Restrictive -> cut bias)
- Under Market TIPS (r* = +1.82%): Gap = (1.48% - 1.82%) * 100 = -34 bps (Accommodative -> hold bias)
- Valuation Swing on 10Y Fair Yield = +100 bps shift in terminal anchor
Real Policy Stance Gap and Semi-Structural Decomposition Math#
Quantifying the real policy gap (r_actual - r*) across competing specifications illustrates why FOMC committee hawks and doves interpret identical macro data differently.
Institutional Neutral Rate Benchmark Comparison#
Asset allocators synthesize academic, regional Reserve Bank, and cleared market benchmarks under Federal Reserve and CFTC data frameworks.
| r* Benchmark Framework | Publishing Institution | Real r* Estimate | Nominal Neutral (at 2% PCE) | Implied Policy Stance at 3.88% EFFR |
|---|---|---|---|---|
| Holston-Laubach-Williams (HLW) | NY Fed (Federal Reserve) | +0.82% | 2.82% | +66 bps Restrictive |
| FOMC SEP Longer-Run Median | Federal Reserve System | +1.00% | 3.00% | +48 bps Mildly Restrictive |
| 5y5y TIPS Forward (Adj) | Dealer Spline (Cantor) | +1.82% | 3.82% | -34 bps Mildly Accommodative |
| Lubik-Matthes TVP-VAR (LM) | Richmond Fed Research | +2.15% | 4.15% | -67 bps Accommodative |
Fiscal Crowding Out, AI Investment Demand, and the z-Factor Shift#
Macroeconomic theory anchors real r* at the intersection of desired global saving and investment. Structural upward shifts since 2020 stem from three simultaneous shocks: persistent primary US federal deficits absorbing domestic private savings, data-center and power-grid capital formation raising corporate investment demand, and waning foreign central bank reserve accumulation. Together, those forces lift the non-growth z wedge from -0.65% pre-2020 to +0.35% in market-implied pricing.
Macro allocation frameworks connect this note to FOMC Policy Path, SOMA Runoff & US Treasury Term Premia, SOMA Monthly Redemption Caps, MBS Prepayment, and TIC Foreign Official Treasury Custody Flows, indexed under FOMC Policy Path alongside tracked macro entities.
Frequently asked questions
Why did the NY Fed modify the Holston-Laubach-Williams model after the 2020 pandemic?
Extreme Q2-Q3 2020 GDP swings violated Gaussian error assumptions in the original Kalman filter; the 2023 HLW update introduced time-varying innovation variance scaling and a supply-disruption indicator to prevent permanent filter distortion.
Why does the Richmond Fed Lubik-Matthes r* estimate sit more than 130 bps above HLW?
Lubik-Matthes uses an unconstrained Bayesian TVP-VAR without imposing downward-sloping IS curve priors; when US output stayed strong during 2023-2025 rate hikes, the model raised its 5-year conditional real rate equilibrium.
Can 5y5y forward TIPS yields be read directly as market expectations of real r*?
Not directly. Five-year, five-year forward TIPS yields equal expected long-run real short rates plus a forward real term premium (+25 to +35 bps) minus a TIPS illiquidity discount (~8 to 12 bps).
How do chronic federal budget deficits raise the neutral rate r*?
Persistent primary deficits reduce national saving at full employment, requiring higher real equilibrium interest rates (a positive z-factor shift) to clear private investment and sovereign debt absorption.
Publication record
- Published
- November 14, 2026
- Updated
- November 14, 2026
- Author
- Dr. Marcus Vance, CFA
- Review
- Review not recorded
- Automated fact check
- Passed in the stored pipeline record
- Source URLs
- 3 recorded
AI assistance recorded: anthropic/claude-opus-4.6. This field does not establish human review or source verification.
Academic & Institutional Attribution
Cite This Research & Embed Live Data Card
Standard academic & institutional research paper citation format.
Dr. Marcus Vance, CFA. (2026, November 14). Holston-Laubach-Williams vs Lubik-Matthes Neutral Rate (r*) Estimation in US Rates. AlphaPulse Finance. https://alphapulsefin.com/analysis/holston-laubach-williams-lubik-matthes-neutral-rate-r-starRelated Fomc Treasury Term Premium & Institutional Briefings
Explore Fomc Treasury Term Premium Hub (20) →Fomc Treasury Term Premium
FOMC Policy Path, SOMA Runoff & US Treasury Term Premia: Institutional Rates GuideFomc Treasury Term Premium
SOMA Monthly Redemption Caps, MBS Prepayment Drag & Secondary T-Bill ReinvestmentFomc Treasury Term Premium
US Treasury Liquidity-Support Buybacks: Off-the-Run Spline Errors & Old/New 20Y-30Y SpreadsFomc Treasury Term Premium
Treasury General Account (TGA) Cash Rebuilds & T-Bill Share Exceeding TBAC 20% GuidanceFomc Treasury Term Premium
US Treasury 2s10s & 5s30s Bear Steepening: Fiscal Supply vs Term Compensation RegimesFomc Treasury Term Premium
CME Ultra 10-Year & Classic Bond Futures: Cheapest-to-Deliver Switches & Implied RepoFomc Treasury Term Premium
30-Year SOFR Swap Spread Inversion: Balance Sheet Constraints vs Sovereign Issuance SupplyFomc Treasury Term Premium
TIC Foreign Official Treasury Custody Flows & FX-Hedged Yield Pickup for Global ReservesSofr Repo Funding Liquidity
NY Fed Standing Repo Facility (SRF) Usage: Auction Timing, Tri-Party Settlement & StigmaSofr Repo Funding Liquidity
DTCC FICC Sponsored DVP Repo: Multilateral Netting & ASC 210-20 Balance Sheet ReliefSofr Repo Funding Liquidity
SEC Rule 17ad-22(e)(6) Treasury Central Clearing Mandate: Done-With vs Done-Away MarginSofr Repo Funding Liquidity
FR 2004 Primary Dealer Net Coupon Inventories & Overnight Repo Rollover Risk Metrics
AlphaPulse Finance Data, Benchmarks & Contributor Records
CC BY 4.0 Open Data
Open Institutional Datasets (CSV / JSON) →
Download desk-compiled quantitative series & schemas.
2026 Reference Matrix
2026 Institutional Benchmarks & Thresholds →
Statutory capital, clearing, margin & rate conventions.
Editorial Records
Authors & Review Records →
View named contributors where those records are available.
Complete Index
Master Research & Dossier Archive →
Browse all published briefings by topic pillar & date.