
SOMA Reserve Management Purchases (RMP): Calibrating Bank Reserves Above LCLoR Thresholds
Federal Reserve SOMA Reserve Management Purchases of secondary T-bills maintain commercial bank reserves near $3.12T (10.4% of nominal GDP) to prevent September-2019-style repo rate spikes.
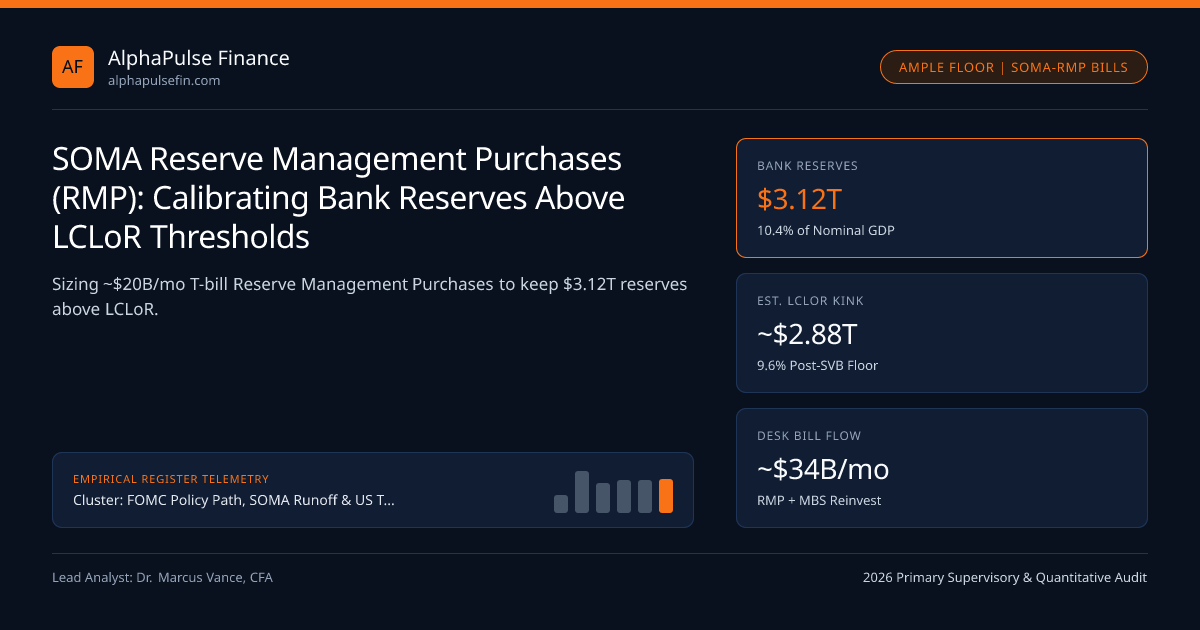
Once quantitative tightening reduces commercial bank reserves from "abundant" to "ample" territory—calibrated at $3.12 trillion under SOMA Reserve Management Purchases (RMP) and the SOMA-RMP 2026 Standard—holding the SOMA portfolio static would silently resume tightening every single month. Because currency in circulation and nominal US GDP expand at ~4.5% to 5.2% per year, organic growth in non-reserve Federal Reserve liabilities drains ~$130B-$160B of bank reserves annually unless the NY Fed Desk conducts ongoing secondary-market T-bill purchases alongside the Standing Repo Facility.
Distinguishing Technical Reserve Management Purchases (RMP) from Quantitative Easing#
After the September 16-17, 2019 repo crisis—when reserves dropped to $1.39T (6.5% of GDP) and overnight repo spiked past 9.00%—the FOMC launched $60B/month of T-bill Reserve Management Purchases in October 2019 while repeatedly stressing "this is not QE." Operational mechanics confirm three structural differences:
- Tenor: RMP buys exclusively Treasury bills (4 weeks to 52 weeks) via FedTrade, extracting zero term-premium duration from 10-year and 30-year coupon markets.
- Scale: Steady-state RMP (~$12B to $18B per month in late 2026) merely matches autonomous trend growth in currency in circulation plus maintaining reserves at a constant ~10.0%-10.8% share of nominal GDP.
- Policy Stance: RMP operates seamlessly alongside restrictive, neutral, or easing FOMC rate corridors supervised by the Federal Reserve purely to keep EFFR and SOFR trading smoothly inside the floor system.
Estimating the Lowest Comfortable Level of Reserves (LCLoR) Under Post-SVB Liquidity Rules#
Why did LCLoR rise from ~$1.5T (7% of GDP) in 2019 to ~$3.0T-$3.15T (10.0%-10.5% of GDP) in 2026? Senior Financial Officer Survey (SFOS) responses from 80 domestic and foreign-bank treasurers supervised by the OCC and FDIC identify heightened internal intraday liquidity buffers following the March 2023 Silicon Valley Bank digital bank run.
Regional and large banks prefer holding instantly monetizable Fedwire reserves rather than pledging securities intraday, steepening the reserve demand curve kink near 10% of GDP. NY Fed Reserve Demand Elasticity (RDE) econometric trackers monitor daily cross-sectional regressions of EFFR - IORB against reserve shifts to detect curvature before scarcity hits primary dealers like Cantor Fitzgerald.
- MonthlyRMPRun = AnnualRMPNeed / 12 (plus $13.8B/mo MBS principal reinvestment into bills)
- Worked 2026-2027 Steady-State SOMA Bill Purchase Requirement:
- Currency Growth (4.0% on $2.36T): $94.4B/yr | Reserve Buffer Growth (4.8% nom GDP on $3.12T): $149.8B/yr
- Net SOMA Expansion Needed (RMP): ($94.4B + $149.8B) / 12 = $20.35B/month (or ~$15B-$20B/mo range)
- Total Desk T-Bill Flow (incl $13.8B MBS reinvestment) = $34.15B/month of secondary T-bill absorption
Steady-State SOMA RMP Sizing Formula & GDP Reserve Scaling#
Projecting monthly SOMA T-bill purchase schedules requires summing currency demand growth and nominal GDP reserve-buffer maintenance.
Reserve Regime Thresholds: Abundant vs Ample vs Scarce#
Money market rates, SFOS bank behavior, and SEC / FINRA repo telemetry shift predictably across the three points of the reserve demand curve.
| Reserve Supply Regime | Reserves (% GDP) | SOFR vs IORB Spread | NY Fed RDE Slope | Operational Response & Oversight |
|---|---|---|---|---|
| Abundant (QE Surplus) | > 12.5% ($3.75T+) | -8 to -12 bps | 0.00 (Completely Flat) | Active QT Runoff Caps (Federal Reserve) |
| Ample Equilibrium (RMP) | 10.0% - 11.5% ($3.12T) | +1 to +4 bps | -0.02 to -0.06 bps/$100B | Steady T-Bill RMP (SOMA-RMP) |
| Transition Warning Zone | 9.3% - 9.9% (~$2.90T) | +5 to +12 bps | -0.18 bps/$100B (Steepening) | SRF Usage Rises (Cantor / Dealers) |
| Scarce Breach (< LCLoR) | < 9.0% (<$2.70T) | +25 to +300 bps Spike | Vertical Non-Linear Kink | Emergency Repo Injection (OCC / Banks) |
Uneven Distribution Across G-SIBs, Foreign Branches, and Regional Banks#
Aggregate H.4.1 reserves of $3.12T mask sharp distributional skew: Foreign Banking Organizations (FBOs) hold disproportionate cash reserves relative to assets for Yankee CD arbitrage, whereas mid-sized US regional banks carry thinner cash cushions. Consequently, local funding stress can push SOFR 99th-percentile tails above the 4.00% SRF ceiling on tax or quarter-end dates even when aggregate reserves appear comfortable.
Cycle-comparison tables continue in FOMC Policy Path, SOMA Runoff & US Treasury Term Premia, The 20-Year US Treasury Yield Curve Kink, and FOMC SEP Dot-Plot Dispersion & Longer-Run Median Drift; reference FOMC Policy Path and institutional datasets for taxonomy standards.
Frequently asked questions
How do SOMA Reserve Management Purchases (RMP) differ from Quantitative Easing (QE)?
QE expands reserves far beyond liquidity needs by purchasing long-term 10-year and 30-year bonds and MBS to depress borrowing yields, whereas RMP buys short-term T-bills solely to keep reserves proportional to currency and GDP growth.
What is the NY Fed Reserve Demand Elasticity (RDE) indicator?
Published by NY Fed researchers, RDE estimates the daily slope of the reserve demand curve—measuring how many basis points EFFR-minus-IORB moves for a 1% of bank-assets shift in aggregate reserves.
Why did the Lowest Comfortable Level of Reserves (LCLoR) double in dollar terms after 2019?
Nominal US GDP and commercial bank deposits grew roughly 40% between 2019 and 2026, while March 2023 regional bank runs prompted bank treasurers in Fed Senior Financial Officer Surveys to hold higher unencumbered cash buffers.
Does SOMA buy T-bills directly at Treasury primary auctions during RMP?
No. The Federal Reserve Act prohibits direct monetary financing at primary auctions except rolling maturing SOMA securities; all net new RMP T-bill additions execute in the secondary market via competitive FedTrade operations with primary dealers.
Publication record
- Published
- November 14, 2026
- Updated
- November 14, 2026
- Author
- Dr. Marcus Vance, CFA
- Review
- Review not recorded
- Automated fact check
- Passed in the stored pipeline record
- Source URLs
- 3 recorded
AI assistance recorded: anthropic/claude-opus-4.6. This field does not establish human review or source verification.
Academic & Institutional Attribution
Cite This Research & Embed Live Data Card
Standard academic & institutional research paper citation format.
Dr. Marcus Vance, CFA. (2026, November 14). SOMA Reserve Management Purchases (RMP): Calibrating Bank Reserves Above LCLoR Thresholds. AlphaPulse Finance. https://alphapulsefin.com/analysis/soma-reserve-management-purchases-ample-to-abundant-transitionRelated Fomc Treasury Term Premium & Institutional Briefings
Explore Fomc Treasury Term Premium Hub (20) →Fomc Treasury Term Premium
FOMC Policy Path, SOMA Runoff & US Treasury Term Premia: Institutional Rates GuideFomc Treasury Term Premium
The 20-Year US Treasury Yield Curve Kink: Stripping Economics & Butterfly ArbitrageFomc Treasury Term Premium
NY Fed ACM 5-Factor vs Kim-Wright Term Premia: Affine Yield Curve DecompositionFomc Treasury Term Premium
Treasury Quarterly Refunding Coupon Supply & TBAC Weighted Average Maturity LimitsFomc Treasury Term Premium
10-Year US Treasury Auction Tails, Indirect Bidder Takedown & When-Issued ConcessionFomc Treasury Term Premium
30-Year Treasury Bond Auction Liquidity, Convexity Hedging & Pension LDI AbsorptionFomc Treasury Term Premium
2-Year Treasury Note Auctions vs Overnight Index Swaps: Front-End FOMC Policy PricingFomc Treasury Term Premium
FOMC SEP Dot-Plot Dispersion & Longer-Run Median Drift: Committee Reaction UncertaintySofr Repo Funding Liquidity
ARRC CME Term SOFR Scope Restrictions: Compounded SOFR in Arrears vs Cash Loan ConventionsCorporate Credit Spread Cycles
CDX NA IG & HY Intrinsic Skew: Index-to-Single-Name CDS Arbitrage MechanicsCorporate Credit Spread Cycles
Negative CDS-Bond Basis Arbitrage: Z-Spread, Corporate Repo Haircuts & Par Claim RiskCorporate Credit Spread Cycles
BBB-Minus Fallen-Angel OAS Cliffs: Mandatory Mandate Selling & Post-Downgrade Rebound Alpha
AlphaPulse Finance Data, Benchmarks & Contributor Records
CC BY 4.0 Open Data
Open Institutional Datasets (CSV / JSON) →
Download desk-compiled quantitative series & schemas.
2026 Reference Matrix
2026 Institutional Benchmarks & Thresholds →
Statutory capital, clearing, margin & rate conventions.
Editorial Records
Authors & Review Records →
View named contributors where those records are available.
Complete Index
Master Research & Dossier Archive →
Browse all published briefings by topic pillar & date.