
FOMC SEP Dot-Plot Dispersion & Longer-Run Median Drift: Committee Reaction Uncertainty
Upward migration of the FOMC Summary of Economic Projections longer-run median dot from 2.50% to 3.00% alongside 88 bps of interquartile dispersion elevates 1y2y swaption volatility across macro rates desks.
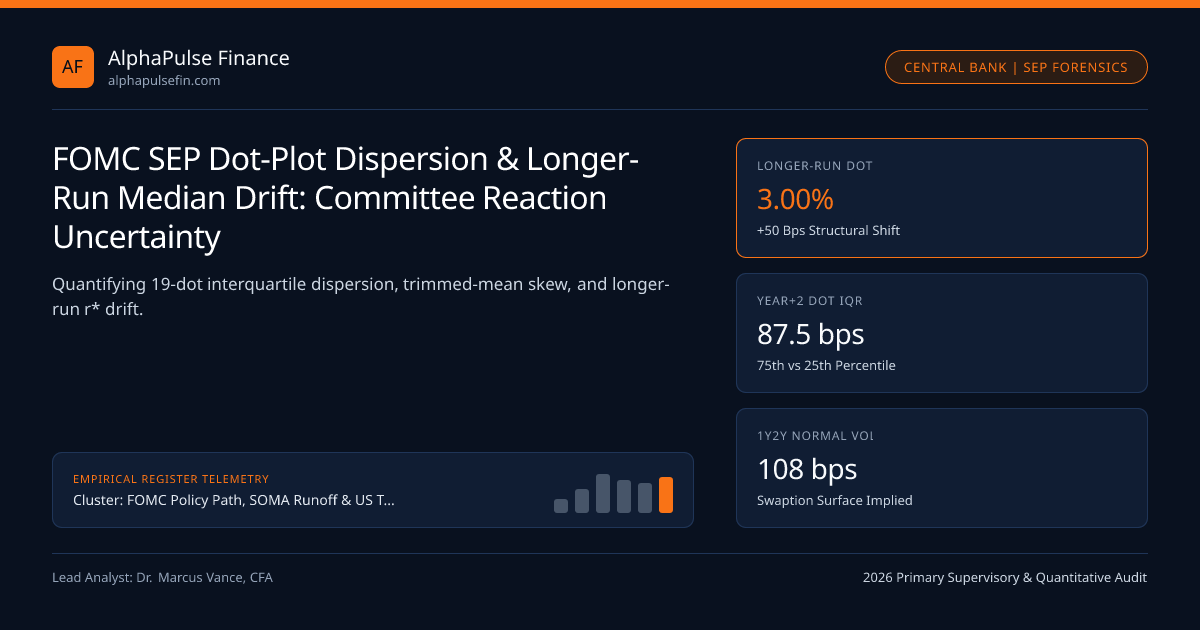
Four times per year—in March, June, September, and December—the 19 participants of the Federal Open Market Committee (7 Board Governors plus 12 Reserve Bank Presidents) submit anonymous rate projections in the Summary of Economic Projections (SEP). Markets obsess over the median dot, yet institutional volatility desks focus on two deeper structural signals governing the FOMC 3.75%-4.00% Corridor: the steady upward migration of the "Longer-Run" neutral nominal rate median from 2.50% (2019-2023) to 3.00% under the 2026 Corridor Framework, and an 88 bps interquartile spread across two-year-ahead participant dots.
Median Fragility: How Two Participant Shifts Reprice $40T in Swaps#
With 19 participants when all Federal Reserve System seats are filled, the median dot corresponds to the 10th-ranked submission. Whenever a bimodal cluster forms—such as nine officials projecting 3.375% and ten projecting 3.625%—a single official shifting 25 bps flips the headline median by a full 25 bps even though the committee mean rose by just 1.3 bps.
Sophisticated macro desks reconstruct participant identities by cross-referencing post-blackout speeches from permanent voters (Board Governors plus the New York Fed President) against rotating regional hawk/dove cohorts. Historically, the "core FOMC leadership median" (Chair, Vice Chair, NY Fed President, and senior Governors) exhibits 35% lower variance than the full 19-dot distribution and leads actual policy execution by one to two quarters.
Longer-Run Dot Drift and 5y5y Forward OIS Re-Anchoring#
For nearly five years through December 2023, the SEP longer-run dot—representing nominal r* (real neutral rate plus 2.00% PCE inflation)—remained pinned at 2.50% (implying a +0.50% real r*). Beginning in March 2024 and extending into 2026, structural AI capital expenditure, fiscal deficits, and productivity resilience pushed the central tendency of longer-run submissions to 2.875%-3.375%, lifting the median to 3.00%.
Every 25-bps upward step in the SEP longer-run median historically passes through at a 0.62 beta into 5y5y forward SOFR OIS rates, establishing a higher valuation floor for 10-year and 30-year cash Treasuries traded across FINRA and CFTC venues.
- DotSkewbps = (TrimmedMeanSEP - MedianDot10) * 100
- Implied1y2yVol = 72bps + 0.41 * IQRYear2_bps
- Worked SEP Distribution Audit (19 Submissions):
- Ordered 10th Dot (Median): 3.125% | 17-Dot Trimmed Mean: 3.210%
- Upper-Tail Hawkish Skew = (3.210% - 3.125%) * 100 = +8.5 bps above headline median
- Year+2 Interquartile Range (15th vs 5th ranked dot): 3.625% - 2.750% = 87.5 bps
- Model Fair 1y2y Normal Volatility = 72 + 0.41(87.5) = 107.9 bps/year
SEP Dispersion Index and Implied Swaption Volatility Transmission#
Committee disagreement translates directly into data-dependent rate volatility: when officials disagree on the reaction function parameters, every monthly CPI or payrolls print triggers larger policy repricing.
SEP Horizon Dispersion vs Swaption Surface Pricing#
Options market makers at primary dealers like Cantor Fitzgerald and institutional managers such as Alpine Woods map each SEP projection column to specific swaption expiry/tenor grid points.
| SEP Projection Horizon | Median Dot | Trimmed Mean | Interquartile Spread | Matched Derivative Hedge & Oversight |
|---|---|---|---|---|
| Current Calendar Year | 3.875% | 3.890% | 25.0 bps | CBOT Fed Funds Futures ZQ (CFTC) |
| Year + 1 Policy Path | 3.375% | 3.445% | 62.5 bps | CME 3M SOFR Pack/Reds (NFA) |
| Year + 2 Policy Path | 3.125% | 3.210% | 87.5 bps | 1y2y Cleared Swaptions (Cantor) |
| Longer-Run Nominal r* | 3.000% | 3.065% | 75.0 bps | 5y5y Forward OIS / 10Y UST (Federal Reserve) |
SEP Uncertainty Fan Charts and Diffusion Indexes of Risk Balance#
Beyond the dot plot, Section 2 of the full SEP release publishes participant diffusion indexes weighting whether risks to core PCE inflation and unemployment are skewed to the upside or downside. When the net upside-inflation risk diffusion index exceeds +0.55 simultaneously with interquartile dot dispersion above 75 bps, asymmetric payer skew on 6m2y SOFR swaptions steepens by 9 to 14 normal vol bps.
Related empirical studies—Holston-Laubach-Williams vs Lubik-Matthes Neutral Rate (r*) plus 30-Year SOFR Swap Spread Inversion—feed directly into FOMC Policy Path, SOMA Runoff & US Treasury Term Premia, the FOMC Policy Path hub, and regulatory bodies.
Frequently asked questions
Do all 19 FOMC SEP dot-plot dots belong to voting committee members?
No. All 7 Board Governors and all 12 Reserve Bank Presidents submit SEP dots, even though only 5 Reserve Bank Presidents (NY plus 4 annual rotators) hold formal policy votes in any given calendar year.
What does the FOMC Longer-Run dot represent in macroeconomic terms?
Each participants Longer-Run dot represents the nominal federal funds rate judged consistent with maximum employment and 2.0% PCE inflation in the absence of cyclical shocks—equal to real r* plus 2.0%.
When are individual FOMC participant names linked to specific SEP dots?
Under Federal Reserve transparency rules, full SEP transcripts and attributed participant projection matrices remain sealed for five calendar years before archival release.
Why do rates strategists compute the 17-participant trimmed mean of the dot plot?
Dropping the single highest hawkish outlier and single lowest dovish outlier stabilizes the central tendency and signals whether the distribution leans toward a 25-bps median shift at the next quarterly SEP.
Publication record
- Published
- November 14, 2026
- Updated
- November 14, 2026
- Author
- Dr. Marcus Vance, CFA
- Review
- Review not recorded
- Automated fact check
- Passed in the stored pipeline record
- Source URLs
- 3 recorded
AI assistance recorded: anthropic/claude-opus-4.6. This field does not establish human review or source verification.
Academic & Institutional Attribution
Cite This Research & Embed Live Data Card
Standard academic & institutional research paper citation format.
Dr. Marcus Vance, CFA. (2026, November 14). FOMC SEP Dot-Plot Dispersion & Longer-Run Median Drift: Committee Reaction Uncertainty. AlphaPulse Finance. https://alphapulsefin.com/analysis/fomc-sep-dot-plot-dispersion-median-longer-run-rate-driftRelated Fomc Treasury Term Premium & Institutional Briefings
Explore Fomc Treasury Term Premium Hub (20) →Fomc Treasury Term Premium
FOMC Policy Path, SOMA Runoff & US Treasury Term Premia: Institutional Rates GuideFomc Treasury Term Premium
Holston-Laubach-Williams vs Lubik-Matthes Neutral Rate (r*) Estimation in US RatesFomc Treasury Term Premium
SOMA Monthly Redemption Caps, MBS Prepayment Drag & Secondary T-Bill ReinvestmentFomc Treasury Term Premium
US Treasury Liquidity-Support Buybacks: Off-the-Run Spline Errors & Old/New 20Y-30Y SpreadsFomc Treasury Term Premium
Treasury General Account (TGA) Cash Rebuilds & T-Bill Share Exceeding TBAC 20% GuidanceFomc Treasury Term Premium
US Treasury 2s10s & 5s30s Bear Steepening: Fiscal Supply vs Term Compensation RegimesFomc Treasury Term Premium
CME Ultra 10-Year & Classic Bond Futures: Cheapest-to-Deliver Switches & Implied RepoFomc Treasury Term Premium
30-Year SOFR Swap Spread Inversion: Balance Sheet Constraints vs Sovereign Issuance SupplySofr Repo Funding Liquidity
ON RRP Facility Drainage & Rule 2a-7 Money Market Fund Rotation into Short T-BillsSofr Repo Funding Liquidity
NY Fed Standing Repo Facility (SRF) Usage: Auction Timing, Tri-Party Settlement & StigmaSofr Repo Funding Liquidity
DTCC FICC Sponsored DVP Repo: Multilateral Netting & ASC 210-20 Balance Sheet ReliefSofr Repo Funding Liquidity
SEC Rule 17ad-22(e)(6) Treasury Central Clearing Mandate: Done-With vs Done-Away Margin
AlphaPulse Finance Data, Benchmarks & Contributor Records
CC BY 4.0 Open Data
Open Institutional Datasets (CSV / JSON) →
Download desk-compiled quantitative series & schemas.
2026 Reference Matrix
2026 Institutional Benchmarks & Thresholds →
Statutory capital, clearing, margin & rate conventions.
Editorial Records
Authors & Review Records →
View named contributors where those records are available.
Complete Index
Master Research & Dossier Archive →
Browse all published briefings by topic pillar & date.