
The 20-Year US Treasury Yield Curve Kink: Stripping Economics & Butterfly Arbitrage
Trading at 4.74% against 4.32% 10-year notes and 4.61% 30-year bonds, the 20-year US Treasury bond forms a +55 bps 10s20s30s butterfly kink driven by segmented natural demand.
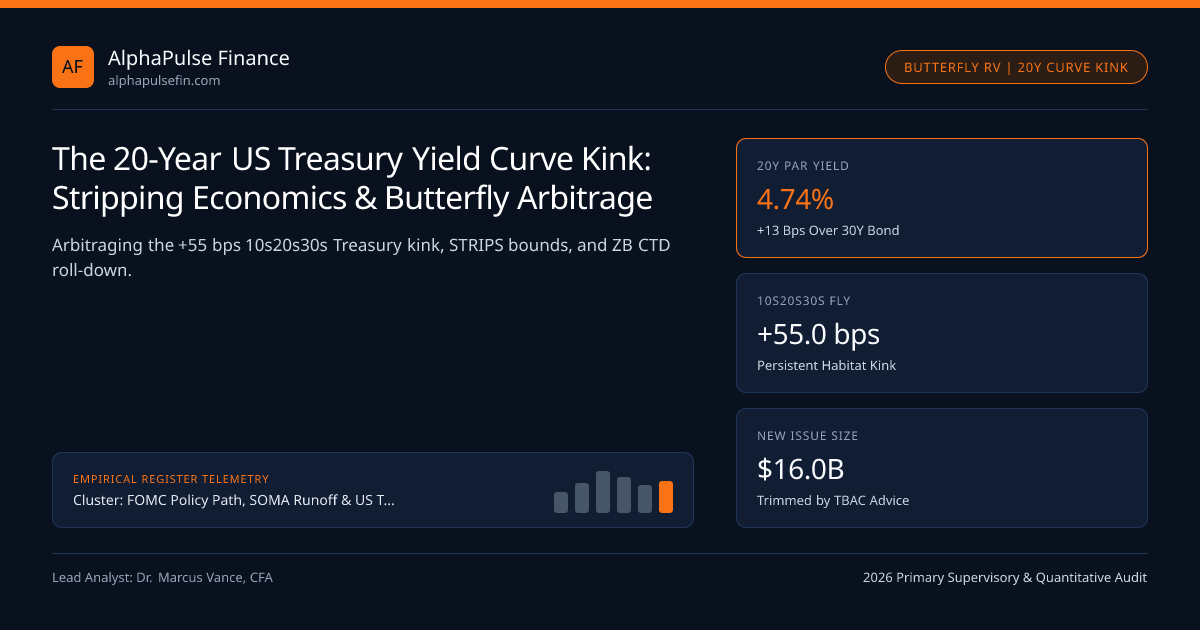
Plot the par US Treasury yield curve across long maturities and a striking structural anomaly jumps off the screen: the 20-year bond consistently yields 4.74%—42 bps above the 10-Year Benchmark Note (4.32%) and 13 bps higher than the longer-duration 30-Year Long Bond (4.61%). Reintroduced in May 2020 after a 34-year hiatus, the 20-year sector suffers an acute "habitat vacuum" that leaves the 10s20s30s par butterfly (2*Y_20Y - Y_10Y - Y_30Y) persistently positive at +55 bps despite quarterly auction cuts and $4B Treasury Buybacks.
Preferred-Habitat Segmentation and the CME Futures Orphan Problem#
Why do institutional buyers crowd into 10-year and 30-year points while demanding a concession to hold 20-year bonds? Three microstructural frictions reinforce the kink:
- No Dedicated Liquid CME Futures Contract: CME launched a 20-Year T-Bond future (TWE) in 2022, yet open interest remains a fraction of Classic T-Bond (ZB, 15Y-25Y basket where 15Y-16Y bonds are CTD) and Ultra T-Bond (UB, 25Y-30Y basket). Fresh 20-year new issues sit stranded in the middle—not Cheapest-to-Deliver into ZB for another four years.
- LDI Convexity Efficiency: Pension LDI managers prefer 30-year Principal STRIPS (29.3 years duration, 886 convexity) over 20-year bonds (12.95 years duration, 206 convexity), creating rich reconstitution demand at 30Y.
- Index & ETF Concentration: Multi-asset macro hedgers benchmark duration at 10Y while long-duration Treasury ETFs (such as 20+ year funds regulated by the SEC) rebalance mechanically across the whole 20Y-30Y bucket.
Why Stripping Arbitrage Caps the 10s20s30s Fly Near +65 Bps#
If 20-year par bonds cheapen too far above the interpolated 10Y-30Y zero-coupon curve, primary dealers such as Cantor Fitzgerald execute coupon-strip vs principal-strip arbitrage: buying cheap cash 20-year bonds on FINRA TRACE, stripping them via Fedwire into 40 semiannual coupon strips plus a 20-year Principal STRIP, and selling the generic 1Y-20Y coupon strips into rich 30-year bond reconstitution packages.
However, because the 20-year Principal STRIP itself cannot substitute for a 30-year Principal STRIP, dealers must warehouse the residual 20-year PO on balance sheet—imposing a no-arbitrage bound around +60 to +72 bps on the 10s20s30s par butterfly even after Treasury scaled 20-year new issues down to $16B ($13B reopenings).
- 5050DV01Wings: Short 0.50 * DV01Belly in 10Y + Short 0.50 * DV01_Belly in 30Y
- Worked $100M 20Y Belly Long Butterfly Setup:
- Long $100.0M 20Y Bond (ModDur 12.95, Conv 206) -> Belly DV01 = +$129,500/bp
- Short $79.45M 10Y Note (ModDur 8.15, Conv 78) -> 10Y Wing DV01 = -$64,750/bp
- Short $39.48M 30Y Bond (ModDur 16.40, Conv 342) -> 30Y Wing DV01 = -$64,750/bp
- Par Fly Spread = 2(4.74%) - 4.32% - 4.61% = +0.55% (+55.0 bps positive carry belly pickup)
DV01-Neutral 50:50 Butterfly Weighting & Convexity Adjustment Math#
Constructing a market-neutral long-belly 10s20s30s butterfly requires matching both total portfolio DV01 to zero and isolating pure curvature roll-down from parallel slope shifts.
Long-End Benchmark Comparison: 10Y vs 20Y vs 30Y Microstructure#
Comparing auction sizes, futures hedging liquidity (CFTC), and buyback support shows why real-money income portfolios at firms like Alpine Woods harvest highest sovereign par yield at the 20-year point.
| Curve Point | Par Yield | Auction Size (New/Reopen) | CME Futures CTD Match | Primary Buyer & Regulatory Venue |
|---|---|---|---|---|
| 10-Year Note | 4.32% | $42B / $39B | Ultra 10Y (TN) Direct | Global Macro & FX Reserves (Federal Reserve) |
| 15.5-Year Seasoned | 4.54% | Secondary Off-the-Run | Classic T-Bond (ZB) CTD | Cash-Futures Basis Funds (CFTC) |
| 20-Year Bond | 4.74% | $16B / $13B | Orphan (Small TWE OI) | Yield-Focused Real Money & Buybacks (FINRA) |
| 30-Year Bond | 4.61% | $25B / $22B | Ultra Bond (UB) at Yr 25 | DB Pension STRIPS LDI (Cantor) |
Harvesting Roll-Down from 20Y into the Classic ZB CTD Window#
Seasoned 20-year bonds issued in 2021-2022 represent one of fixed income's cleanest multi-quarter roll trades: as a 20-year bond seasons past 4.5 years and approaches 15 years and 3 months remaining to maturity, it suddenly becomes Cheapest-to-Deliver into the ultra-liquid CME Classic T-Bond (ZB) contract—compressing its spline cheapness by 8 to 14 bps as leveraged basis funds accumulate deliverable float.
Historical calibration series link NY Fed ACM 5-Factor vs Kim-Wright Term Premia, Holston-Laubach-Williams vs Lubik-Matthes Neutral Rate (r*), and FOMC Policy Path, SOMA Runoff & US Treasury Term Premia directly to FOMC Policy Path and verification registry.
Frequently asked questions
Why did the US Treasury reintroduce the 20-year bond in May 2020 and later cut its size?
Treasury revived the 20-year bond in May 2020 at $20B-$27B sizes to extend WAM during massive pandemic deficits, but scaled sizes down to $16B/$13B after weak end-user demand pushed 20Y yields persistently above 30Y.
How is the 10s20s30s Treasury butterfly calculated and weighted?
In yield space, the butterfly equals (2 * 20Y Yield) minus 10Y Yield minus 30Y Yield (+55 bps). In trade execution, desks weight each wing at 50% of the 20-year belly’s DV01 ($79.5M 10Y and $39.5M 30Y per $100M 20Y).
Does a 50:50 DV01-weighted long-20Y butterfly give up positive convexity?
Slightly. Combining 50% 10Y convexity (78) and 50% 30Y convexity (342) averages 210 convexity units on the short wings versus 206 on the long 20Y belly—making the trade nearly convexity-neutral while earning +55 bps spread.
Why are 10Y-20Y off-the-run bonds prime targets in US Treasury $4B buyback operations?
Pandemic-era 20-year issues rolled down into the 14-to-19-year sector with deep discount prices and wide bid-ask spreads; retiring them via FedTrade buybacks delivers maximum spline-smoothing benefit per dollar spent.
Publication record
- Published
- November 14, 2026
- Updated
- November 14, 2026
- Author
- Dr. Marcus Vance, CFA
- Review
- Review not recorded
- Automated fact check
- Passed in the stored pipeline record
- Source URLs
- 3 recorded
AI assistance recorded: anthropic/claude-opus-4.6. This field does not establish human review or source verification.
Academic & Institutional Attribution
Cite This Research & Embed Live Data Card
Standard academic & institutional research paper citation format.
Dr. Marcus Vance, CFA. (2026, November 14). The 20-Year US Treasury Yield Curve Kink: Stripping Economics & Butterfly Arbitrage. AlphaPulse Finance. https://alphapulsefin.com/analysis/twenty-year-treasury-bond-kink-microstructure-arbitrage-pricingRelated Fomc Treasury Term Premium & Institutional Briefings
Explore Fomc Treasury Term Premium Hub (20) →Fomc Treasury Term Premium
FOMC Policy Path, SOMA Runoff & US Treasury Term Premia: Institutional Rates GuideFomc Treasury Term Premium
NY Fed ACM 5-Factor vs Kim-Wright Term Premia: Affine Yield Curve DecompositionFomc Treasury Term Premium
Treasury Quarterly Refunding Coupon Supply & TBAC Weighted Average Maturity LimitsFomc Treasury Term Premium
10-Year US Treasury Auction Tails, Indirect Bidder Takedown & When-Issued ConcessionFomc Treasury Term Premium
30-Year Treasury Bond Auction Liquidity, Convexity Hedging & Pension LDI AbsorptionFomc Treasury Term Premium
2-Year Treasury Note Auctions vs Overnight Index Swaps: Front-End FOMC Policy PricingFomc Treasury Term Premium
FOMC SEP Dot-Plot Dispersion & Longer-Run Median Drift: Committee Reaction UncertaintyFomc Treasury Term Premium
Holston-Laubach-Williams vs Lubik-Matthes Neutral Rate (r*) Estimation in US RatesCorporate Credit Spread Cycles
CDX NA IG & HY Intrinsic Skew: Index-to-Single-Name CDS Arbitrage MechanicsCorporate Credit Spread Cycles
Negative CDS-Bond Basis Arbitrage: Z-Spread, Corporate Repo Haircuts & Par Claim RiskCorporate Credit Spread Cycles
BBB-Minus Fallen-Angel OAS Cliffs: Mandatory Mandate Selling & Post-Downgrade Rebound AlphaCorporate Credit Spread Cycles
US High-Yield 2026-2028 Maturity Wall: Coupon Reset Math & EBITDA Coverage Erosion
AlphaPulse Finance Data, Benchmarks & Contributor Records
CC BY 4.0 Open Data
Open Institutional Datasets (CSV / JSON) →
Download desk-compiled quantitative series & schemas.
2026 Reference Matrix
2026 Institutional Benchmarks & Thresholds →
Statutory capital, clearing, margin & rate conventions.
Editorial Records
Authors & Review Records →
View named contributors where those records are available.
Complete Index
Master Research & Dossier Archive →
Browse all published briefings by topic pillar & date.