
SOFR vs EFFR & IORB Corridor Spreads: Measuring Reserve Demand Elasticity Near Scarcity
Positive inversion of secured SOFR (3.91%) above unsecured EFFR (3.88%) and IORB (3.90%) signals collateral-heavy balance sheet pressure across Federal Reserve money market corridors.
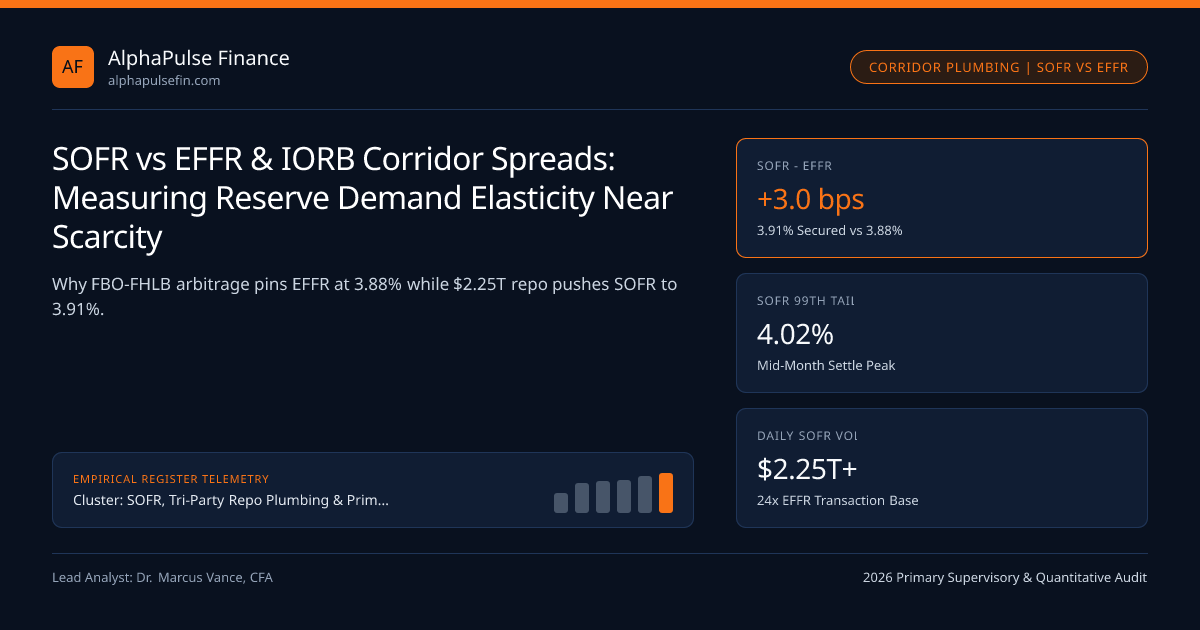
Classical credit pricing suggests an unsecured interbank loan should command a higher interest rate than a loan 102% collateralized by US Treasury bills—yet in Q4 2026, secured SOFR (3.91%) trades +3 bps above the unsecured Effective Federal Funds Rate (EFFR, 3.88%) and +1 bps above Interest on Reserve Balances (IORB, 3.90%) inside the FOMC 3.75%-4.00% Corridor. That counterintuitive spread structure arises from institutional market segmentation and serves as the Federal Reserve's primary early-warning gauge for calibrating SOMA Reserve Management Purchases.
Why Unsecured EFFR Stays Pinned at 3.88% While Secured SOFR Climbs#
Post-2008 Liquidity Coverage Ratio (LCR) and FDIC deposit assessment rules virtually extinguished true interbank federal funds lending among domestic US commercial banks. Today, roughly 85% to 90% of the ~$92 billion daily EFFR volume represents Federal Home Loan Banks (FHLBs)—which lack eligibility to earn 3.90% IORB at the Federal Reserve—lending cash overnight at 3.88% to branches of Foreign Banking Organizations (FBOs) that deposit the proceeds straight into their NY Fed accounts at 3.90% to pocket a riskless 2-bps IORB arbitrage.
Because EFFR reflects this narrow, sluggish FHLB-to-FBO regulatory arbitrage, EFFR barely budged by 1 bps across $2.1 trillion of SOMA quantitative tightening! By contrast, SOFR clears $2.25T+ of real Treasury collateral financing across primary dealers like Cantor Fitzgerald, asset managers, and leveraged funds—rising linearly as private Treasury holdings expand.
SOFR 99th-minus-50th Percentile Tail Dispersion as a Scarcity Thermometer#
Relying solely on median SOFR (50th volume percentile, 3.91%) masks acute intraday stress building in the upper right tail. Every morning at 8:00 AM ET, the New York Fed publishes the 1st, 25th, 75th, and 99th volume-weighted percentiles of SOFR transactions.
During the 2022 abundant-reserve regime, SOFR_75th - SOFR_25th compressed to just 3 bps and SOFR_99th - IORB stayed negative. In late 2026, interquartile dispersion sits at 7 to 9 bps on normal days and SOFR_99th routinely prints 3.99% to 4.04% on mid-month coupon settlement dates—confirming non-linear reserve demand curvature tracked by SEC and CFTC money-market monitors.
- FBOFedFundsNetArb = IORB - EFFR - FDICAssessment_FBO (FBOs exempt from FDIC insured base!)
- Worked Corridor Spread & Basis Attribution:
- FBO Arbitrage Pin: IORB (3.90%) - EFFR (3.88%) = +2.0 bps (FBOs uninsured branches pay 0 bps FDIC fee)
- Collateral Saturation Term: +1.0 bps above IORB on $294B dealer coupons -> SOFR = 3.91%
- Implied SOFR - EFFR Basis = 3.91% - 3.88% = +3.0 bps (+3.4 bps 1Y forward including turn dates)
Logistic Reserve Demand Curve & Scarcity Spread Equation#
Afonso, Giannone, La Spada, and Williams (NY Fed) model SOFR - IORB and EFFR - IORB along a nonlinear horizontal-asymptote curve that steepens sharply once bank reserves approach 9.5%-10.0% of nominal GDP.
Overnight Reference Rate Comparison & Counterparty Access#
Understanding who can access Fed liabilities explains why different overnight USD rates sit at distinct rungs of the administered ladder.
| Overnight USD Rate | Daily Volume | Q4 2026 Fixing | Collateralization | Dominant Participants & Regulator |
|---|---|---|---|---|
| ON RRP Award Rate | $88.5B | 3.75% | SOMA UST Tri-Party | 2a-7 MMFs & GSEs (SEC / NY Fed) |
| Effective Fed Funds (EFFR) | ~$92.0B | 3.88% | Unsecured Interbank | FHLBs -> FBO Branches (Federal Reserve) |
| IORB Administered Rate | $3,120.0B | 3.90% | Central Bank Liability | Depository Banks (OCC / FDIC) |
| SOFR Benchmark | $2,250.0B+ | 3.91% | 100%-102% US Treasury | Dealers, MMFs, Basis Funds (Cantor / FINRA) |
Trading SOFR-EFFR Basis Swaps Around QT Taper and Tax Dates#
Cleared SOFR vs EFFR basis swaps cleared on SEFs regulated by the CFTC and NFA allow STIR desks to isolate pure Treasury collateral saturation from FOMC rate moves. Paying SOFR and receiving EFFR at +2.5 bps on 1-year basis swaps carries positive convex upside (+8 to +15 bps) into corporate tax dates, heavy QRA settlement weeks, or unexpected TGA rebuilds without taking any directional exposure to whether the FOMC cuts or holds.
Cross-market desks pair these thresholds with SOFR, Tri-Party Repo Plumbing & Primary Dealer Balance Sheets, ON RRP Facility Drainage & Rule, and Basel III Supplementary Leverage Ratio (SLR inside our SOFR archive and covered institutions directory.
Frequently asked questions
Why dont domestic US G-SIB banks borrow federal funds at 3.88% to earn 3.90% IORB?
Under post-Dodd-Frank rules, the FDIC levies deposit insurance assessments on domestic banks total liabilities (not just insured deposits), costing 2.5 to 9+ bps and wiping out a 2-bps EFFR-IORB spread; uninsured FBO branches are exempt.
Why did EFFR stop functioning as a reliable indicator of reserve scarcity?
Because FHLBs hold captive liquidity buffers and FBOs have elastic balance sheet capacity outside quarter-ends, EFFR remained stuck 7 bps below IORB (at 5.33% vs 5.40%, now 3.88% vs 3.90%) even while repo rates firmed by 18 bps.
What is OBFR (Overnight Bank Funding Rate) compared to EFFR?
Published by the NY Fed, OBFR blends federal funds transactions with offshore Eurodollar deposits and selected domestic deposit placements (~$260B/day total), tracking within 0 to 1 bps of EFFR.
What causes SOFR to jump +4 to +7 bps on the 15th and last day of every month?
US Treasury coupon auctions settle on the 15th and end-of-month; net new cash raised drains reserves into the TGA while dealers finance fresh auction takedowns simultaneously in overnight repo.
Publication record
- Published
- November 14, 2026
- Updated
- November 14, 2026
- Author
- Dr. Marcus Vance, CFA
- Review
- Review not recorded
- Automated fact check
- Passed in the stored pipeline record
- Source URLs
- 3 recorded
AI assistance recorded: anthropic/claude-opus-4.6. This field does not establish human review or source verification.
Academic & Institutional Attribution
Cite This Research & Embed Live Data Card
Standard academic & institutional research paper citation format.
Dr. Marcus Vance, CFA. (2026, November 14). SOFR vs EFFR & IORB Corridor Spreads: Measuring Reserve Demand Elasticity Near Scarcity. AlphaPulse Finance. https://alphapulsefin.com/analysis/sofr-effr-iorb-corridor-spread-reserve-scarcity-elasticityRelated Sofr Repo Funding Liquidity & Institutional Briefings
Explore Sofr Repo Funding Liquidity Hub (20) →Sofr Repo Funding Liquidity
SOFR, Tri-Party Repo Plumbing & Primary Dealer Balance Sheets: Money Market GuideSofr Repo Funding Liquidity
ON RRP Facility Drainage & Rule 2a-7 Money Market Fund Rotation into Short T-BillsSofr Repo Funding Liquidity
NY Fed Standing Repo Facility (SRF) Usage: Auction Timing, Tri-Party Settlement & StigmaSofr Repo Funding Liquidity
DTCC FICC Sponsored DVP Repo: Multilateral Netting & ASC 210-20 Balance Sheet ReliefSofr Repo Funding Liquidity
SEC Rule 17ad-22(e)(6) Treasury Central Clearing Mandate: Done-With vs Done-Away MarginSofr Repo Funding Liquidity
FR 2004 Primary Dealer Net Coupon Inventories & Overnight Repo Rollover Risk MetricsSofr Repo Funding Liquidity
Quarter-End G-SIB Score Window Dressing & Foreign Bank Repo Pullbacks at Turn DatesSofr Repo Funding Liquidity
Basel III Supplementary Leverage Ratio (SLR & eSLR) Constraints on Treasury Repo DealersCorporate Credit Spread Cycles
Negative CDS-Bond Basis Arbitrage: Z-Spread, Corporate Repo Haircuts & Par Claim RiskCorporate Credit Spread Cycles
BBB-Minus Fallen-Angel OAS Cliffs: Mandatory Mandate Selling & Post-Downgrade Rebound AlphaCorporate Credit Spread Cycles
US High-Yield 2026-2028 Maturity Wall: Coupon Reset Math & EBITDA Coverage ErosionCorporate Credit Spread Cycles
Covenant-Lite Liability Management Exercises (LMEs): Uptiers, Drop-Downs & Recovery Compression
AlphaPulse Finance Data, Benchmarks & Contributor Records
CC BY 4.0 Open Data
Open Institutional Datasets (CSV / JSON) →
Download desk-compiled quantitative series & schemas.
2026 Reference Matrix
2026 Institutional Benchmarks & Thresholds →
Statutory capital, clearing, margin & rate conventions.
Editorial Records
Authors & Review Records →
View named contributors where those records are available.
Complete Index
Master Research & Dossier Archive →
Browse all published briefings by topic pillar & date.