
Corporate Credit Spread Cycles
US IG Corporate 10s30s Credit Curve Flattening: Insurer Annuity Demand & Dollar-Price Convexity
Record $415B+ annual US fixed-annuity sales and >103% corporate pension funding ratios have compressed the 10s30s investment-grade corporate credit spread curve to +14 bps against steepening Treasury term premia.
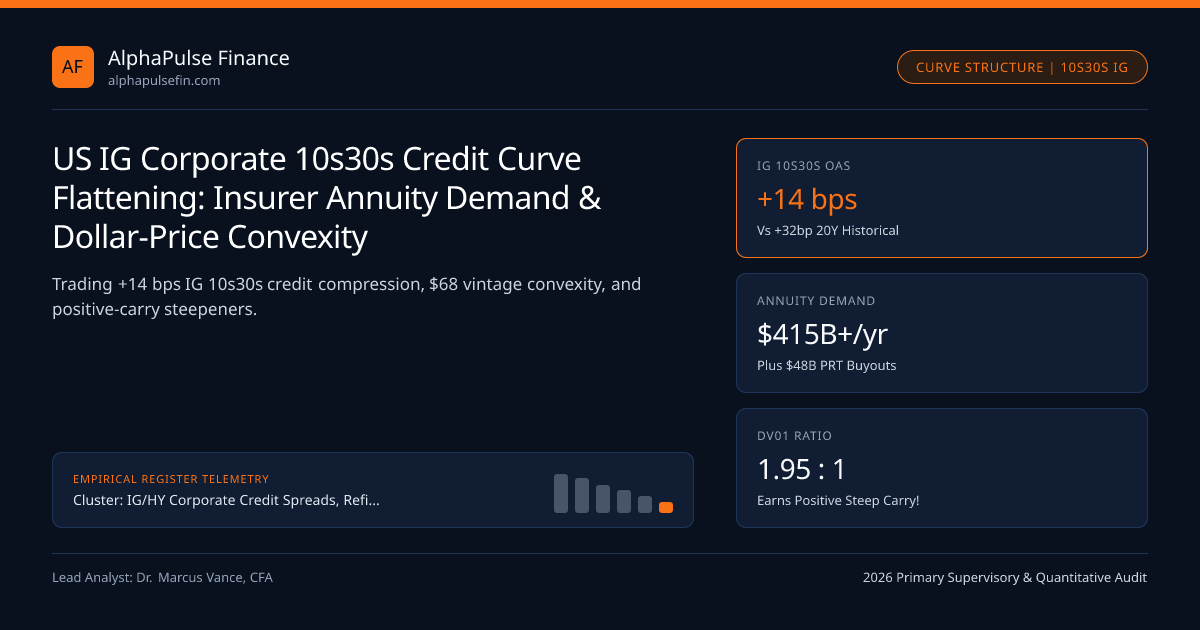
While sovereign 30-Year Long Bond Yields (4.61%) steepened +29 bps above 10-Year Benchmark Notes (4.32%) alongside a positive +44 bps 2s10s Curve, the US Investment-Grade 10s30s Corporate Credit Spread Curve moved in the exact opposite direction—compressing down to just +12 to +16 bps (less than half its 20-year +32 bps median!). Behind that structural inversion between sovereign steepening and credit flattening lies a $550 billion+ annual wall of liability-matching demand from US fixed-annuity insurers and de-risking corporate pension plans colliding with scarce 30-year corporate issuance.
Why CFOs Refuse to Issue 30-Year Debt at 5.60% While Insurers Crave It#
Supply-and-demand elasticity along the corporate maturity curve runs completely counter-cyclical to interest rate levels:
- Corporate CFO Supply Pullback: In 2020-2021 when 30-year IG yields sat at 2.85%, Fortune 500 treasurers flooded the market with 30-year and 40-year bonds (26% of total IG supply). In 2026, with 30-year all-in corporate yields near 5.55% to 5.85%, CFOs refuse to lock in expensive 30-year coupons—shifting issuance into 3-year, 5-year, and 10-year tranches and slashing 30-year share of IG supply down to just 14.5%!
- Insurer & Pension Demand Surge: Simultaneously, aging Baby Boomers poured over $415 billion/year into Multi-Year Guaranteed Annuities (MYGAs) and Fixed Indexed Annuities (FIAs) regulated by state insurance departments like NYSDFS, while ASC 715 corporate pensions reached 103.5% funded status and executed $45B+/yr of Pension Risk Transfers (PRTs)—locking away every available 20-to-30-year A/BBB corporate bond on FINRA TRACE in buy-and-hold custody!
Positive Mathematical Bond Convexity & Low-Dollar-Price 2021 Vintage Advantage#
Beyond raw supply scarcity, 30-year corporate bonds possess two powerful quantitative pricing advantages over 10-year bonds during volatile rate/spread cycles:
- Empirical Spread-Duration Convexity: A par 30-year 5.65% IG bond carries ~14.8 years of Modified/Spread Duration and +345 units of convexity (vs 7.6 duration and +72 convexity on a 10-year). If macro recession fears spark a -75 bps rally in Treasury yields, positive convexity adds +98 bps of excess return on the 30-year!
- Deep-Discount $66-$74 Vintage Scarcity: Massive 2020-2021 30-year issues (2.70%-3.10% coupons due 2050-2051) trade at $66.00 to $74.00 clean dollar prices! Should an issuer suffer a sudden fallen-angel downgrade or LME restructuring toward 45% recovery, a $68 bond risks only 23 points of downside ($68 -> $45), whereas a par $100 10-year bond risks 55 points of downside ($100 -> $45)—forcing structural models to price old 30-year discount OAS 10 to 18 bps tighter than par 10-year curves!
- BoxNetCarrybpsperDV01 = (OAS10Y / 1) - (OAS30Y / 1) + RepoSpecial_Adjustment
- Worked DV01-Neutral 10s30s Credit Curve Steepener (Long $195M 10Y @ +84bp vs Short $100M 30Y @ +98bp):
- Spread DV01 Match: $195M * 7.60 * 0.0001 = $148,200/bp vs $100M * 14.82 * 0.0001 = $148,200/bp (Neutral to parallel OAS!)
- Running Annual Spread Carry Cost = (84 bps * $195M) - (98 bps * $100M) = +$1.638M - $0.980M = +$658,000 POSITIVE Dollar Carry!
- Why positive dollar carry on a steepener?! Because you hold $195M of 10Y spread vs only $100M of 30Y spread!
DV01-Neutral 10s30s Credit Curve Flattener / Steepener Equations#
Executing a pure 10s30s credit spread curve trade requires matching Spread DV01 (~1.95x par of 10Y vs 1.00x par of 30Y) while hedging underlying 10s30s Treasury yield-curve slope!
10s30s Credit Curve Slope by Sector & Dollar-Price Cohort (Q4 2026)#
Notice how regulated utilities and AA/A tech/pharma print ultra-flat (+6 to +11 bps) 10s30s curves, whereas BBB- media/autos trade steep (+34 bps) or inverted in distress.
| Trade Leg / Portfolio Position | Par Notional ($M) | Modified Duration | Spread DV01 ($/bp) | Treasury Rate Hedge Leg |
|---|---|---|---|---|
| Long Par 10Y BBB+ Corporate | +$195.0M | 7.60 Years | +$148,200 / bp | Short $195.0M 10Y UST Note |
| Short Par 30Y BBB+ Corporate | -$100.0M | 14.82 Years | -$148,200 / bp | Long $100.0M 30Y Long Bond |
| Net DV01-Neutral 10s30s Steepener | +$95.0M Net Cash | 0.00 Net Dur | $0 Parallel Credit | Pure 10s30s Credit OAS Box |
| Carry & Convexity Profile | +$1.42M Net Carry | -205 Net Convexity | Wins if 10s30s > +14bp | Reported on FINRA TRACE |
When 10s30s Credit Curves Invert Completely: The Distressed Jump-to-Par Signal#
Credit curve slope acts as an infallible early distress detector across execution desks at Cantor Fitzgerald and Alpine Woods: in healthy IG, 10s30s trades upward-sloping (+14 bps). The moment an issuer's survival come into question, all maturities must trade to the SAME expected dollar recovery price (say $55)! For both a 5-year bond and a 30-year bond to trade at $55, the 5-year yield/OAS must surge to +850 bps while the 30-year OAS rises to only +340 bps—causing the 5s30s and 10s30s credit spread curves to violently invert (-250 to -500 bps)!
Additional stress-test parameters appear in IG/HY Corporate Credit Spreads, Refinancing Walls & CDS Basis, ISDA Credit Event Auctions, Cheapest-to-Deliver Bonds, and Reverse Yankee Corporate Bond Issuance within the IG/HY Corporate Credit Spreads dossier and analytical tools.
Frequently asked questions
How can a DV01-neutral 10s30s credit curve steepener earn positive carry when 30Y OAS (+98 bps) exceeds 10Y OAS (+84 bps)?
Because a 10-year bond has roughly half the duration (7.6 yrs) of a 30-year bond (14.8 yrs), matching Spread DV01 requires buying $195M of 10Y bonds against shorting $100M of 30Y bonds: $195M * 84 bps ($1.64M) beats $100M * 98 bps ($0.98M)!
What is a Pension Risk Transfer (PRT) and why does it flatten the 30-year corporate credit curve?
In a PRT, a corporate defined-benefit pension (>100% funded under ASC 715) transfers billions of retiree liabilities to a life insurer (like Prudential, MetLife, or Athene), which immediately rotates equity holdings into 20-to-30-year IG corporate bonds.
Why do life insurers avoid BBB-minus 30-year bonds even when they crave long-end yield?
A single-notch downgrade from BBB- (NAIC 2.C) to BB+ (NAIC 3.A) on a 15-duration 30-year bond triggers both a 2.1x statutory capital jump AND a massive mark-to-market price drop (~16 points on +110 bps fallen-angel widening).
How do desks execute the short 30-year corporate leg without getting squeezed in cash bond borrow?
Because borrowing specific off-the-run 30Y cash bonds in repo can cost 50-120 bps, many desks express 10s30s credit steepeners synthetically or short newly issued $3B+ liquid 30-year benchmark tranches with deep securities-lending float.
Publication record
- Published
- November 13, 2026
- Updated
- November 14, 2026
- Author
- Dr. Marcus Vance, CFA
- Review
- Review not recorded
- Automated fact check
- Passed in the stored pipeline record
- Source URLs
- 3 recorded
AI assistance recorded: anthropic/claude-opus-4.6. This field does not establish human review or source verification.
Academic & Institutional Attribution
Cite This Research & Embed Live Data Card
Standard academic & institutional research paper citation format.
Dr. Marcus Vance, CFA. (2026, November 14). US IG Corporate 10s30s Credit Curve Flattening: Insurer Annuity Demand & Dollar-Price Convexity. AlphaPulse Finance. https://alphapulsefin.com/analysis/ig-corporate-10s30s-credit-curve-flattening-insurer-annuity-bidRelated Corporate Credit Spread Cycles & Institutional Briefings
Explore Corporate Credit Spread Cycles Hub (20) →Corporate Credit Spread Cycles
IG/HY Corporate Credit Spreads, Refinancing Walls & CDS Basis: Institutional Credit GuideCorporate Credit Spread Cycles
ISDA Credit Event Auctions, Cheapest-to-Deliver Bonds & Orphan CDS Risk After LMEsCorporate Credit Spread Cycles
US G-SIB TLAC HoldCo vs OpCo Credit Spreads: SPOE Bail-In Subordination & Call OptionalityCorporate Credit Spread Cycles
SASB Office CMBS Special Servicing & Regional Bank Sub-Debt Credit ContagionCorporate Credit Spread Cycles
Rising-Star BB-Plus Upgrades: Anticipating Crossover Deleveraging Into Investment GradeCorporate Credit Spread Cycles
iBoxx Total Return Swaps vs CDX Payer Swaptions: Cash-Spread Basis & Tail Convexity HedgingCorporate Credit Spread Cycles
Out-of-Court Distressed Debt Exchanges vs Prepackaged Chapter 11: The 38% Re-Default TrapCorporate Credit Spread Cycles
Reverse Yankee Corporate Bond Issuance: EUR/USD Cross-Currency Basis & ECB-Fed ArbitrageInflation Breakevens Real Rates
Import Tariff Pass-Through Into Core Goods: Price-Level Step Jumps & 2s10s Breakeven InversionInflation Breakevens Real Rates
Zero-Coupon vs Year-on-Year Inflation Caps & Floors: Tail Volatility Smiles & Regime ProbabilitiesInflation Breakevens Real Rates
Employment Cost Index (ECI) vs Average Hourly Earnings & Atlanta Fed Wage TrackerInflation Breakevens Real Rates
Gold Spot Divergence From 10-Year TIPS Real Yields: EM Central Bank Reserve Reallocation
AlphaPulse Finance Data, Benchmarks & Contributor Records
CC BY 4.0 Open Data
Open Institutional Datasets (CSV / JSON) →
Download desk-compiled quantitative series & schemas.
2026 Reference Matrix
2026 Institutional Benchmarks & Thresholds →
Statutory capital, clearing, margin & rate conventions.
Editorial Records
Authors & Review Records →
View named contributors where those records are available.
Complete Index
Master Research & Dossier Archive →
Browse all published briefings by topic pillar & date.