
Corporate Credit Spread Cycles
IG/HY Corporate Credit Spreads, Refinancing Walls & CDS Basis: Institutional Credit Guide
Tight headline US investment-grade (84 bps OAS) and high-yield (292 bps OAS) corporate credit spreads mask sharp CCC refinancing strain, negative CDS-bond basis dislocations, and aggressive covenant-lite liability management exercises across capital markets.
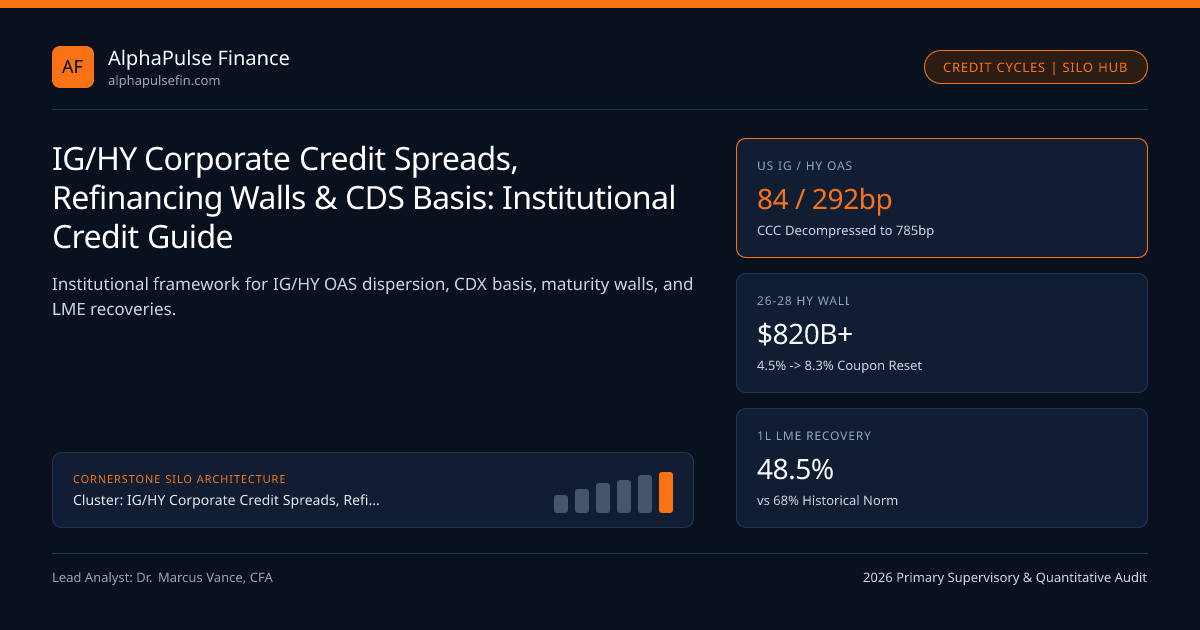
Headline US corporate option-adjusted spreads (OAS) trading near 84 bps in investment grade (IG) and 292 bps in high yield (HY) against 10-Year Benchmark Treasury Yields (4.32%) create an optical illusion of benign credit risk in late 2026. Beneath index medians, dispersion across balance-sheet tiers has reached cycle highs: pension and annuity all-in yield buyers compress A-rated 30-year cash bonds while single-B and CCC borrowers confront coupon resets from pandemic-era 4.50% vintages into 8.25%-10.50% refinancing markets anchored to SOFR (3.91%) and the FOMC 3.75%-4.00% Corridor. Navigating credit allocations requires integrating cash-synthetic CDS basis mechanics, Primary Dealer Inventory constraints, portfolio trading liquidity, and distressed creditor-on-creditor recovery math under SEC, FINRA, and CFTC market rules.
Decomposing Corporate OAS Into Default Loss, Liquidity, and All-In Yield Technicals#
Structural credit models since Elton, Gruber, Agrawal, and Mann demonstrate that expected actuarial default loss explains less than 22% of investment-grade OAS and roughly 44% of BB/B high-yield spreads; the remaining spread compensates investors for state tax differentials, dealer secondary bid-ask illiquidity, and systematic equity-like jump correlation during macro drawdowns. In 2026, elevated sovereign yields near 4.32% inverted traditional spread-vs-yield relationships: pension Liability-Driven Investing (LDI) desks and fixed-annuity insurers target a 5.15% to 5.45% all-in corporate yield hurdle, mechanically bidding down IG spreads whenever Treasury yields back up.
Consequently, credit portfolio managers separate directional beta from cross-market dislocations by tracking CDX NA IG and HY intrinsic skew arbitrage alongside negative CDS-bond basis and Z-spread repo financing. When macro hedge funds buy index protection on cleared CDX.NA.IG faster than cash bondholders sell underlying notes on FINRA TRACE, synthetic spreads widen 8 to 16 bps past intrinsic single-name curves—creating actionable relative-value entry points before cash markets reprice.
Rating Cliffs, 2026-2028 Refinancing Walls, and Creditor-on-Creditor Violence#
Across the IG/HY boundary, mandate segmentation between investment-grade mutual funds, insurance statutory capital charges, and high-yield index trackers generates severe nonlinear price discontinuities. Our empirical breakdown of BBB-minus fallen-angel OAS cliffs and forced selling paired with rising-star BB-plus deleveraging alpha shows that ~115 bps of the 155-bps downgrade widening occurs prior to formal rating agency action, followed by a 15-to-25-day technical overshoot at month-end index deletion.
Lower down the capital structure, over $820 billion of speculative-grade bonds and institutional term loans mature across the 2026-2028 US high-yield maturity wall. Borrowers rolling 2020-2021 fixed coupons of 4.625% into 8.35% new-issue yields suffer immediate EBITDA-to-interest coverage compression from 4.1x toward 2.3x. Rather than filing traditional Chapter 11 petitions, private-equity sponsors exploit covenant-lite liability management exercises (LMEs) and out-of-court distressed debt exchanges, stripping collateral into unrestricted subsidiaries (J.Crew/Chewy drop-downs) or priming minority lenders via Serta-style non-pro-rata uptiers—slashing first-lien recoveries from historical 68% norms down toward 46% to 52% on legacy tranches.
- CDSBondBasis = CDSParSpread5Y - CashBondZSpread_SOFR
- Worked Q4 2026 BBB Corporate & Basis Attribution (5-Year Benchmark):
- Cumulative Annualized Hazard Rate (PD_annual): 0.42% (42 bps) at 48% LME-adjusted recovery -> 21.8 bps expected loss
- State Tax + TRACE Bid-Ask Liquidity Lambda + Systematic Equity-Jump Beta: +86.2 bps risk compensation
- Equilibrium 5Y BBB Cash Z-Spread over SOFR: 108.0 bps | Matched 5Y Single-Name CDS: 91.5 bps
- Implied Negative CDS-Bond Basis = 91.5 - 108.0 = -16.5 bps (reflecting dealer repo balance-sheet cost)
Primary Concessions, Portfolio Trading, ETF Arbitrage, and Private Credit Channels#
Secondary corporate bond market microstructure underwent a structural transformation over the past five years. Because G-SIB capital charges keep primary dealer corporate inventories lean relative to a $10.8 trillion US corporate bond stock, execution increasingly flows through automated portfolio trading protocols, FINRA TRACE block dissemination caps, and fixed-income credit ETF create/redeem custom baskets intermediated by Authorized Participants and primary dealers such as Cantor Fitzgerald. In primary syndication, syndicate desks calibrate IG primary new-issue concessions (NIC) of 2 to 6 bps against orderbook oversubscription ratios (3.4x median) and Reverse Yankee EUR/USD cross-currency funding arbitrage.
Simultaneously, floating-rate corporate credit splits between syndicated US BSL CLO structures and CCC overcollateralization tests and $1.7 trillion of non-bank direct lending. Monitoring private credit unitranche PIK toggles and non-accrual dispersion reveals how Business Development Companies (BDCs) regulated under the Investment Company Act by the SEC convert cash interest into Payment-in-Kind (PIK) accruals—deferring headline defaults while compounding terminal leverage.
Cross-Asset Equity-Credit Signals, Bank Bail-In Debt, and Tail Convexity#
Quantitative multi-asset desks link equity volatility surfaces directly to credit curves through Merton structural distance-to-default models, exploiting the empirical lead of single-stock put skew over illiquid cash bonds. Along the maturity spectrum, IG 10s30s credit curve flattening reflects persistent long-end insurer demand, whereas financial sector spreads split across US G-SIB TLAC HoldCo vs OpCo bail-in tiers and SASB office CMBS regional bank subordinated debt supervised by the Federal Reserve, OCC, and FDIC.
When tail events hit, derivative settlement mechanics dominate P&L: ISDA credit event auctions and orphan CDS risks determine recovery payouts after corporate debt restructurings, while systematic hedgers evaluate carry-to-convexity trade-offs between iBoxx total return swaps and CDX payer swaptions cleared under CFTC oversight. Full spread calibration standards appear on our methodology and benchmarks portals alongside the Corporate Credit Spread Cycles hub.
| Credit Market Venue / Tier | Regulatory / Market Anchor | Primary Reporting Feed | Q4 2026 Benchmark Metric | Dominant Arbitrage / Risk Vector |
|---|---|---|---|---|
| US IG Cash Corporate Bonds | FINRA / SEC | TRACE 15-Min ($5M+ Cap) | 84 bps OAS / 5.16% Yield | Negative CDS-bond basis & 10s30s insurer flattening |
| Cleared Index CDS (CDX IG/HY) | CFTC / ICE Clear Credit | SDR Real-Time Swaps Tape | 52.5 bps IG / 328 bps HY | Intrinsic skew vs single-name SNAC baskets |
| Primary Syndicate & ETF Baskets | Cantor Fitzgerald | New Issue Wire / NSCC PCF | 3.2 bps NIC / 3.4x Cover | ETF create/redeem custom basket bond stripping |
| G-SIB Bank TLAC & Sub-Debt | Federal Reserve / FDIC | FR Y-9C & Reg YY Filings | +28 bps HoldCo-OpCo Spread | Structural subordination & SPOE bail-in triggers |
| BSL CLOs & BDC Direct Lending | SEC / OCC | Form 10-Q / Intex Trustee | SOFR+136 AAA / 8.4% PIK | 7.5% CCC bucket haircuts & LME priming dilution |
Institutional Credit Execution, Clearing, and Regulatory Oversight Matrix#
Executing cash-synthetic credit arbitrage and distressed capital-structure trades spans distinct statutory perimeters: cash corporate bonds clear T+1 through DTCC NSCC and report to FINRA TRACE within 15 minutes; index CDS and CDX swaptions clear at ICE Clear Credit under CFTC swaps jurisdiction; single-name security-based swaps fall under SEC Regulation SBSR; and multi-asset execution platforms such as Ally Invest, Atomic Capital, and Alpine Woods route institutional and wealth credit allocations across electronic RFQ books.
Frequently asked questions
Why do US investment-grade credit spreads stay below 90 bps even when Treasury rates exceed 4.30%?
Defined-benefit corporate pensions (~103% funded) and life insurers writing record fixed annuities buy corporate bonds based on all-in yield (>5.15%) rather than spread alone, absorbing net IG issuance after coupon reinvestments.
Why is the CDX.NA.IG 5-year index spread (~52.5 bps) tighter than the Bloomberg US IG cash OAS (~84 bps)?
CDX.NA.IG holds an equally weighted basket of 125 liquid 5-year senior unsecured investment-grade names excluding subordinated financials and 30-year duration, whereas the cash IG index averages ~7.1 years duration with ~29% BBB-minus and bank HoldCo paper.
What is a negative CDS-bond basis trade and why does it persist in institutional credit markets?
A negative basis occurs when 5-year CDS protection costs fewer basis points than the matched cash bond Z-spread over SOFR. Buying both the cash bond and CDS locks in risk-free spread, but requires scarce dealer repo balance sheet and haircut capital.
How have Liability Management Exercises (LMEs) altered distressed credit recovery modeling?
Weak incurrence covenants allow sponsors to transfer crown-jewel IP to unrestricted subsidiaries or issue super-priority priming debt to a 50.1% lender majority, shifting value away from minority par lenders and lowering Chapter 11 emergence recoveries.
Publication record
- Published
- November 14, 2026
- Updated
- November 14, 2026
- Author
- Dr. Marcus Vance, CFA
- Review
- Review not recorded
- Automated fact check
- Passed in the stored pipeline record
- Source URLs
- 4 recorded
AI assistance recorded: anthropic/claude-opus-4.6. This field does not establish human review or source verification.
Academic & Institutional Attribution
Cite This Research & Embed Live Data Card
Standard academic & institutional research paper citation format.
Dr. Marcus Vance, CFA. (2026, November 14). IG/HY Corporate Credit Spreads, Refinancing Walls & CDS Basis: Institutional Credit Guide. AlphaPulse Finance. https://alphapulsefin.com/analysis/ig-hy-corporate-credit-spreads-maturity-walls-cds-basis-guideRelated Corporate Credit Spread Cycles & Institutional Briefings
Explore Corporate Credit Spread Cycles Hub (20) →Corporate Credit Spread Cycles
CDX NA IG & HY Intrinsic Skew: Index-to-Single-Name CDS Arbitrage MechanicsCorporate Credit Spread Cycles
Negative CDS-Bond Basis Arbitrage: Z-Spread, Corporate Repo Haircuts & Par Claim RiskCorporate Credit Spread Cycles
BBB-Minus Fallen-Angel OAS Cliffs: Mandatory Mandate Selling & Post-Downgrade Rebound AlphaCorporate Credit Spread Cycles
US High-Yield 2026-2028 Maturity Wall: Coupon Reset Math & EBITDA Coverage ErosionCorporate Credit Spread Cycles
Covenant-Lite Liability Management Exercises (LMEs): Uptiers, Drop-Downs & Recovery CompressionCorporate Credit Spread Cycles
IG Primary Bond New-Issue Concession (NIC): Orderbook Oversubscription & Syndicate CompressionCorporate Credit Spread Cycles
FINRA TRACE Block Dissemination Caps & Automated Credit Portfolio Trading MicrostructureCorporate Credit Spread Cycles
Fixed-Income Credit ETF Create/Redeem Arbitrage: Custom Baskets & Stale-NAV Liquidity DiscoveryInflation Breakevens Real Rates
TIPS Breakevens, CPI Shelter Persistence & Forward Real Rates: Institutional GuideInstitutional Earnings Capex Macro
S&P 500 Margin Dispersion, Hyperscaler Capex & Buyback Flows: Institutional Earnings GuideFomc Treasury Term Premium
NY Fed ACM 5-Factor vs Kim-Wright Term Premia: Affine Yield Curve DecompositionMonetary Policy
China’s Central Bank Signals Easing Restraint as Growth Holds Up
AlphaPulse Finance Data, Benchmarks & Contributor Records
CC BY 4.0 Open Data
Open Institutional Datasets (CSV / JSON) →
Download desk-compiled quantitative series & schemas.
2026 Reference Matrix
2026 Institutional Benchmarks & Thresholds →
Statutory capital, clearing, margin & rate conventions.
Editorial Records
Authors & Review Records →
View named contributors where those records are available.
Complete Index
Master Research & Dossier Archive →
Browse all published briefings by topic pillar & date.