
Corporate Credit Spread Cycles
FINRA TRACE Block Dissemination Caps & Automated Credit Portfolio Trading Microstructure
Electronic credit portfolio trading—executing 50 to 400 CUSIPs simultaneously as an all-or-none basket—now accounts for over 18.5% of institutional FINRA TRACE corporate volume while slashing illiquid bid-ask execution costs by 42%.
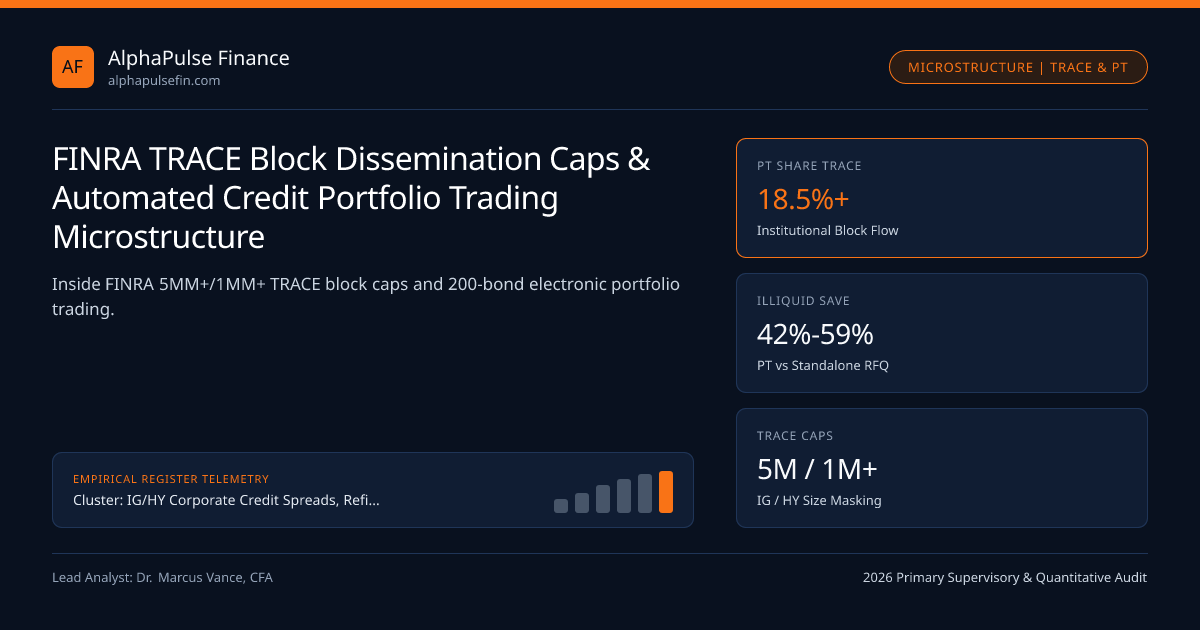
Twenty years ago, executing a $300 million reallocation across 120 off-the-run corporate CUSIPs required days of bilateral phone voice-brokering and leaked positioning across rival desks within 15 minutes on FINRA TRACE (Trade Reporting and Compliance Engine). In 2026, electronic Credit Portfolio Trading (PT) clears more than 18.5% of institutional US corporate bond volume—allowing asset managers to send a 250-bond long/short basket to three dealers, receive unified net-basis-point quotes in four minutes against 10-Year US Treasury and SOFR benchmarks, and compress off-the-run execution friction by 40% to 55% without straining Primary Dealer Balance Sheets.
FINRA TRACE 15-Minute Reporting & The $5MM+ IG / $1MM+ HY Masking Rules#
Under FINRA Rule 6730 overseen by the SEC, broker-dealers must report corporate bond executions to TRACE as soon as practicable—and within 15 minutes (with ongoing regulatory proposals debating 1-minute automation vs block delays). To protect liquidity providers warehousing large blocks from immediate predatory front-running, TRACE masks exact trade notional on public market-data feeds above strict Dissemination Caps:
- Investment Grade (IG) Corporate Bonds: Any trade exceeding $5,000,000 par displays publicly on real-time TRACE simply as "5MM+".
- High Yield (HY) Corporate Bonds: Any trade exceeding $1,000,000 par displays publicly simply as "1MM+".
Exact uncapped block volumes become public only in FINRA's historic delayed data release (6 months later)! Nevertheless, sophisticated microstructure algorithms watch simultaneous 5MM+ prints supplemented by the TRACE Portfolio Trade (PT) Modifier across 150 CUSIPs at the exact same timestamp (14:12:08 ET) to infer whether dealers just absorbed a $400M risk-transfer buy or sell basket.
Why Dealers Price a 200-Bond Portfolio Tighter Than Individual Line-Item RFQs#
How can an algorithmic credit desk at a major dealer or execution venue alongside Cantor Fitzgerald quote an off-the-run 2033 BBB industrial bond inside 1.2 bps of mid inside a Portfolio Trade when a standalone Request-for-Quote (RFQ) on that exact bond costs 6.5 bps?
Three ETF-linked portfolio synergies drive the 42% cost collapse:
- Diversified Idiosyncratic Risk: Informed toxic flow ("adverse selection" ahead of an earnings miss or LME) targets single CUSIPs, never a diversified 200-bond basket—eliminating dealer adverse-selection markup!
- Internal Long/Short Cross-Netting: Two-way rebalancing baskets (selling $150M of 5-year financials to buy $150M of 10-year industrials) self-hedge credit spread beta (DTS) immediately on entry.
- Instant Credit ETF Create/Redeem Recycling: Algorithmic PT desks immediately feed 70% to 85% of acquired basket CUSIPs into LQD, VCIT, VCSH, or HYG Custom Creation/Redemption Baskets at T+1 close, shedding inventory off balance sheet in less than 24 hours!
- CostPortfolioBasket = (SigmaBasketTrackingError * RiskAversionGamma) + ETFCreateRedeemFee
- Worked $200M 150-CUSIP Off-the-Run IG Rebalance Comparison:
- Standalone 150 Line-Item RFQs: Weighted-Average Slippage = 5.20 bps * 6.80 Dur = 0.354% ($707,200 friction)
- All-or-None Portfolio Trade (82% ETF Basket Overlap, 18% Residual):
- Portfolio Slippage = 2.15 bps * 6.80 Dur = 0.146% ($292,400 friction) -> $414,800 (58.7%) Instant Execution Alpha!
Portfolio Trade Execution Cost vs Line-Item RFQ Adverse-Selection Equation#
Decomposing line-item bid-ask versus basket-level risk charge demonstrates why Portfolio Trading dominates whenever basket breadth exceeds N >= 35 CUSIPs.
TRACE Reporting Parameters, Modifiers, and Execution Protocol Comparison#
Institutional traders route orders across Voice Block, Anonymous All-to-All Open Trading, Line-Item RFQ, and Portfolio Trading depending on ticket size vs CUSIP liquidity score.
| Execution Protocol | Ideal Ticket Profile | TRACE Public Footprint | Adverse Selection Risk | Primary Liquidity Source |
|---|---|---|---|---|
| Portfolio Trading (PT) | 40 - 400 CUSIPs ($50M-$1B) | Simultaneous PT Flag Prints | Near Zero (Diversified) | Algo ETF/PT Desks (Cantor / G-SIBs) |
| Anonymous All-to-All RFQ | $250K - $5M Odd/Round Lots | Standard TRACE (<15 Min) | Moderate | Buy-Side Peers + HFT Credit Pods |
| Bilateral Voice Block | $25M - $150M Single CUSIP | Masked as 5MM+ / 1MM+ | High (Single-Name Informed) | Voice Relationship Balance Sheet |
| Automated Auto-Ex RFQ | < $1M LiquidIG/HY Tickets | Sub-5-Second Algo Print | Low | Systematic Market Makers (FINRA) |
Reading Intraday TRACE Portfolio-Trade Waves as a Lead Credit Indicator#
Because TRACE tags every leg of a basket execution with the explicit Portfolio Trade (P) flag, real-time quantitative feeds aggregate net dealer-buy vs dealer-sell PT prints every 30 minutes (classifying trade direction via TRACE's explicit Dealer Buy from Customer vs Dealer Sell to Customer indicator!). When net customer-sell PT flow exceeds $3.5 billion by 1:00 PM ET, cash IG spreads widen an average 1.4 to 2.2 bps into the 4:00 PM ET index close.
Macro allocation frameworks connect this note to IG/HY Corporate Credit Spreads, Refinancing Walls & CDS Basis, Fixed-Income Credit ETF Create/Redeem Arbitrage, and US G-SIB TLAC HoldCo vs OpCo Credit Spreads, indexed under IG/HY Corporate Credit Spreads alongside tracked macro entities.
Frequently asked questions
Why does FINRA mask corporate bond trade sizes above $5M for IG and $1M for HY on live TRACE?
If rival desks saw immediately that a dealer just bought $85M of an illiquid bond, competitors would pull bids or short ahead of the dealer’s unwind—discouraging dealers from committing balance sheet to institutional blocks.
Why did institutional buy-side traders push back against shortening FINRA TRACE block reporting from 15 minutes to 1 minute?
While >85% of small electronic trades already report within 60 seconds, voice block traders need several minutes to put on Treasury or CDX hedges across multiple desks before alerting the market with a 5MM+ print.
Can an asset manager include highly illiquid 20-year off-the-run bonds inside a Portfolio Trade?
Yes—that is Portfolio Trading’s killer advantage. As long as 75%-80% of the basket holds liquid or ETF-eligible bonds, dealers absorb 20% "tail" illiquid CUSIPs inside the unified net basket quote at a fraction of standalone RFQ cost.
What is the difference between a TRACE "Customer Buy" and "Inter-Dealer" print?
TRACE explicitly tags every execution as Dealer-to-Customer Buy (B), Dealer-to-Customer Sell (S), or Inter-Dealer (D), allowing microstructure models to measure net real-money customer inflows separately from dealer hot-potato churn.
Publication record
- Published
- November 13, 2026
- Updated
- November 14, 2026
- Author
- Dr. Marcus Vance, CFA
- Review
- Review not recorded
- Automated fact check
- Passed in the stored pipeline record
- Source URLs
- 3 recorded
AI assistance recorded: anthropic/claude-opus-4.6. This field does not establish human review or source verification.
Academic & Institutional Attribution
Cite This Research & Embed Live Data Card
Standard academic & institutional research paper citation format.
Dr. Marcus Vance, CFA. (2026, November 14). FINRA TRACE Block Dissemination Caps & Automated Credit Portfolio Trading Microstructure. AlphaPulse Finance. https://alphapulsefin.com/analysis/finra-trace-block-dissemination-caps-credit-portfolio-tradingRelated Corporate Credit Spread Cycles & Institutional Briefings
Explore Corporate Credit Spread Cycles Hub (20) →Corporate Credit Spread Cycles
IG/HY Corporate Credit Spreads, Refinancing Walls & CDS Basis: Institutional Credit GuideCorporate Credit Spread Cycles
Fixed-Income Credit ETF Create/Redeem Arbitrage: Custom Baskets & Stale-NAV Liquidity DiscoveryCorporate Credit Spread Cycles
US BSL CLO Arbitrage: AAA Liability Spreads, 7.5% CCC Buckets & Junior OC Test DiversionCorporate Credit Spread Cycles
Private Credit Unitranche PIK Toggles & BDC Non-Accrual Dispersion: Shadow Default AuditCorporate Credit Spread Cycles
Merton Structural Distance-to-Default: Equity Put Skew Leading Corporate Credit SpreadsCorporate Credit Spread Cycles
US IG Corporate 10s30s Credit Curve Flattening: Insurer Annuity Demand & Dollar-Price ConvexityCorporate Credit Spread Cycles
ISDA Credit Event Auctions, Cheapest-to-Deliver Bonds & Orphan CDS Risk After LMEsCorporate Credit Spread Cycles
US G-SIB TLAC HoldCo vs OpCo Credit Spreads: SPOE Bail-In Subordination & Call OptionalityInflation Breakevens Real Rates
1Y & 2Y Zero-Coupon Inflation Swaps: RBOB Gasoline Crack Spreads & WTI Pass-ThroughInflation Breakevens Real Rates
D’Amico-Kim-Wei (DKW) Model: Separating TIPS Liquidity Premia From Inflation Risk PremiaInflation Breakevens Real Rates
Core PCE Imputed Financial Services & Portfolio Management Fees: S&P 500 Equity Beta in InflationInflation Breakevens Real Rates
30-Year TIPS Real Yield Auctions: February/August Supply Liquidity & Real-Annuity LDI Demand
AlphaPulse Finance Data, Benchmarks & Contributor Records
CC BY 4.0 Open Data
Open Institutional Datasets (CSV / JSON) →
Download desk-compiled quantitative series & schemas.
2026 Reference Matrix
2026 Institutional Benchmarks & Thresholds →
Statutory capital, clearing, margin & rate conventions.
Editorial Records
Authors & Review Records →
View named contributors where those records are available.
Complete Index
Master Research & Dossier Archive →
Browse all published briefings by topic pillar & date.