
Corporate Credit Spread Cycles
Merton Structural Distance-to-Default: Equity Put Skew Leading Corporate Credit Spreads
Treating corporate equity as a call option and risky debt as risk-free par minus a put on firm assets allows Merton Distance-to-Default and 25-delta equity put skew to lead illiquid corporate bond spreads by 3 to 9 sessions.
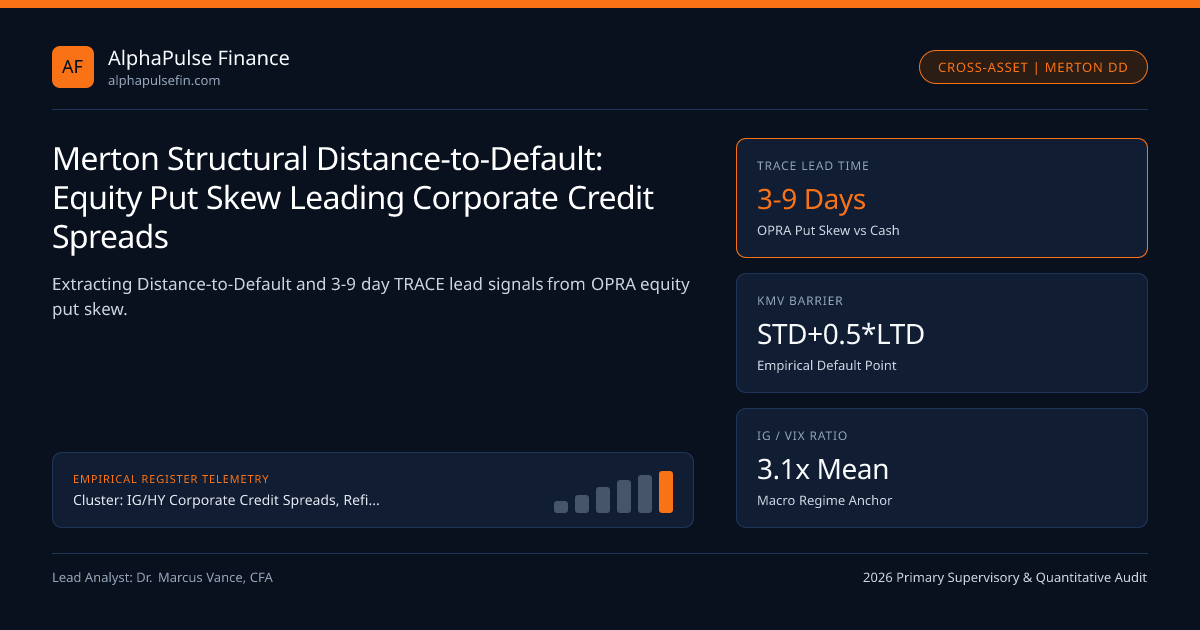
Robert Merton's 1974 structural insight unified equity and debt markets under a single Black-Scholes identity: shareholders own a call option on firm enterprise assets struck at the face value of debt, while corporate bondholders own a risk-free Treasury/SOFR bond and are short a default put option. Because OPRA-listed single-stock equity options reprice continuously in sub-milliseconds while 60% of off-the-run corporate bonds trade sporadically on FINRA TRACE, Merton Distance-to-Default (DD) and deep out-of-the-money equity put implied volatility systematically lead cash credit spread widening by 3 to 9 trading days across multi-asset books benchmarking 10-Year US Treasury Yields.
Solving Two Unobservables: Unlevering Equity Cap & Equity Vol Into Asset Volatility#
In practice, neither true market Enterprise Asset Value (VA) nor Asset Volatility (sigmaA) can be observed directly on GAAP balance sheets. Quantitative credit systems (Moody's KMV / Bloomberg DRSK) solve a simultaneous two-equation nonlinear root-finder every afternoon:
- Equity Value Identity: E = VA * N(d1) - K * exp(-rT) * N(d_2), where the Moody's KMV empirical Default Point (K) equals 100% of Short-Term Debt + 50% of Long-Term Debt (because firms rarely default just because long-term debt exceeds asset value—if short-term cash holds out, equity stays alive as an out-of-the-money call!).
- Ito's Lemma Volatility Link: sigmaE * E = N(d1) * sigmaA * VA.
Watch what happens when an issuer's stock price drops -22% while 3-month ATM equity implied volatility jumps from 26% to 44%: Distance-to-Default (DD, measured in asset standard deviations above the default barrier) collapses nonlinearly from 4.8 sigma (A-rated) down to 2.1 sigma (BB-rated)—flashing an immediate sell signal before cash bondholders react against Primary Dealer Inventories.
Credit-Implied Volatility vs Deep OTM Equity Put Skew (Capital-Structure Arb)#
Pure Gaussian Merton models famously underpredict short-dated investment-grade spreads ("the short-spread puzzle") because firm assets can jump downward discontinuously (CreditGrades / Jump-Diffusion extensions). That jump risk links 5-year Single-Name CDS directly to 1-year 10-delta / 25-delta Single-Stock Put Options regulated by the SEC and index volatility cleared under the CFTC!
Multi-strategy Capital-Structure Arbitrage ("Cap-Arb") desks plot every issuer's 5Y CDS Spread vs Equity Implied Volatility (100-day rolling regression):
- Rich Cash/CDS vs Cheap Equity Puts (LBO / Leveraged Buyback Risk): Wait—be careful! If management launches a debt-funded share buyback or LBO, both CDS widens and stock rises—destroying naive delta-hedged stock-vs-CDS trades! Buying deep OTM $15/$20 strike equity puts against selling CDS protection isolates pure bankruptcy wipeout (where stock MUST hit $0) while avoiding LBO squeeze blowups!
- CreditEquityDelta = (dDebt / dEquity) = [ (1 - N(d1)) / N(d1) ] * (V_A / E) [adjusted for recovery]
- Worked BBB-to-BB Equity Shock Audit ($18B Market Cap -> $12B, KDefault = $14B, sigmaE jumps 25% -> 40%):
- Initial State: VA = $32.0B, sigmaA = 14.2%, 1Y DD = [ln(32/14)] / 0.142 = 5.82 sigma (Safe IG)
- Post-Shock State: VA = $26.0B, sigmaA = 18.8%, 1Y DD = [ln(26/14)] / 0.188 = 3.29 sigma -> Fair 5Y OAS jumps +95 bps!
Merton Distance-to-Default (DD) & CreditGrades Hedge Ratio Equations#
Differentiating risky debt value with respect to equity price yields the exact Empirical Credit-to-Equity Delta (dBond / dStock) across rating tiers.
Empirical Equity Hedge Ratios & Lead-Lag Coefficients Across Credit Tiers#
Notice the striking convexity of equity delta: an A-rated bond has near-zero equity sensitivity (0.02 delta), whereas a distressed $62 CCC bond trades with 0.48 equity delta!
| Corporate Event Shock | Equity Stock Price | 5Y CDS / Cash OAS | Naive Stock-vs-CDS Arb P&L | Deep OTM Put-vs-CDS Arb P&L |
|---|---|---|---|---|
| Secular Earnings Collapse | Plunges -65% | Widens +450 bps | Profitable (Both Move Together) | Highly Profitable (Put Gamma Explodes) |
| Debt-Funded Share Buyback | Rallies +12% | Widens +65 bps! | SEVERE LOSS (Short Stock + Short Protection!) | Protected (Small Put Theta Decay Only) |
| Equity-Funded Deleveraging | Diluted -8% | Tightens -80 bps! | WINDFALL GAIN (Both Legs Win!) | Profitable (CDS Tightens > Put Gain) |
| Cash All-Equity Takeover by AA | Jumps +30% | Collapses to 35 bps | Loss on Short Stock Exceeds CDS Gain | WINDFALL GAIN (CDS Rallies; Put Capped) |
Systematic VIX-to-CDX Regime Signals for Macro Credit Overlay#
At the macro index level, plotting CDX.NA.IG (bps) against VIX (vol pts) reveals structured regime loops executed across platforms like Cantor Fitzgerald and Capitals Gain. Whenever CDX.NA.IG / VIX drops below 2.4x during an equity vol spike (e.g., VIX jumps to 26 while CDX sits at 56 bps), CDX payer spreads offer asymmetric catch-up convexity; once CDX.NA.IG / VIX exceeds 3.8x after VIX mean-reverts while credit lags, selling CDX protection captures systematic vol-crush carry.
Quantitative pods link this specification with US IG Corporate 10s30s Credit Curve Flattening, Out-of-Court Distressed Debt Exchanges vs Prepackaged Chapter 11, and IG/HY Corporate Credit Spreads, Refinancing Walls & CDS Basis; browse IG/HY Corporate Credit Spreads or verification registry for live benchmarks.
Frequently asked questions
Why does the Moody’s KMV model set the Default Barrier at Short-Term Debt plus only HALF of Long-Term Debt?
Empirical bankruptcy studies show corporations frequently survive years with asset value slightly below total face debt as long as long-term bonds haven’t matured; actual insolvency triggers mid-way between short-term liabilities and total debt.
Why did classic 2005 GM/Kirkorian capital-structure arbitrage funds suffer losses despite being "hedged"?
Funds bought GM 5Y CDS protection (or shorted bonds) and bought GM stock delta-hedged; when Kirk Kerkorian launched a tender offer for GM stock while S&P downgraded GM debt to junk, stock soared AND CDS blew out simultaneously!
Why do pure Gaussian Merton models underpredict 1-year and 2-year investment-grade credit spreads?
Under smooth Brownian motion without jumps, a 5-sigma firm has virtually 0.0001% probability of crossing the default barrier inside 12 months; real markets price accounting fraud/jump-to-default risk (+25 bps) plus illiquidity premia.
How do macro credit PMs use the CDX.NA.IG to VIX ratio for tactical hedging?
Over 2020-2026, 5Y CDX.NA.IG (bps) averages roughly 3.0x to 3.2x VIX. Ratios below 2.4x indicate credit is complacent relative to equity vol (buy CDX protection); ratios above 3.9x indicate credit panic overshot equity vol.
Publication record
- Published
- November 13, 2026
- Updated
- November 14, 2026
- Author
- Dr. Marcus Vance, CFA
- Review
- Review not recorded
- Automated fact check
- Passed in the stored pipeline record
- Source URLs
- 3 recorded
AI assistance recorded: anthropic/claude-opus-4.6. This field does not establish human review or source verification.
Academic & Institutional Attribution
Cite This Research & Embed Live Data Card
Standard academic & institutional research paper citation format.
Dr. Marcus Vance, CFA. (2026, November 14). Merton Structural Distance-to-Default: Equity Put Skew Leading Corporate Credit Spreads. AlphaPulse Finance. https://alphapulsefin.com/analysis/merton-structural-distance-to-default-equity-vol-credit-leadRelated Corporate Credit Spread Cycles & Institutional Briefings
Explore Corporate Credit Spread Cycles Hub (20) →Corporate Credit Spread Cycles
IG/HY Corporate Credit Spreads, Refinancing Walls & CDS Basis: Institutional Credit GuideCorporate Credit Spread Cycles
US IG Corporate 10s30s Credit Curve Flattening: Insurer Annuity Demand & Dollar-Price ConvexityCorporate Credit Spread Cycles
ISDA Credit Event Auctions, Cheapest-to-Deliver Bonds & Orphan CDS Risk After LMEsCorporate Credit Spread Cycles
US G-SIB TLAC HoldCo vs OpCo Credit Spreads: SPOE Bail-In Subordination & Call OptionalityCorporate Credit Spread Cycles
SASB Office CMBS Special Servicing & Regional Bank Sub-Debt Credit ContagionCorporate Credit Spread Cycles
Rising-Star BB-Plus Upgrades: Anticipating Crossover Deleveraging Into Investment GradeCorporate Credit Spread Cycles
iBoxx Total Return Swaps vs CDX Payer Swaptions: Cash-Spread Basis & Tail Convexity HedgingCorporate Credit Spread Cycles
Out-of-Court Distressed Debt Exchanges vs Prepackaged Chapter 11: The 38% Re-Default TrapInflation Breakevens Real Rates
BLS CPI Health Insurance Retained-Earnings Method: October Resets vs BEA PPI Medical CareInflation Breakevens Real Rates
Import Tariff Pass-Through Into Core Goods: Price-Level Step Jumps & 2s10s Breakeven InversionInflation Breakevens Real Rates
Zero-Coupon vs Year-on-Year Inflation Caps & Floors: Tail Volatility Smiles & Regime ProbabilitiesInflation Breakevens Real Rates
Employment Cost Index (ECI) vs Average Hourly Earnings & Atlanta Fed Wage Tracker
AlphaPulse Finance Data, Benchmarks & Contributor Records
CC BY 4.0 Open Data
Open Institutional Datasets (CSV / JSON) →
Download desk-compiled quantitative series & schemas.
2026 Reference Matrix
2026 Institutional Benchmarks & Thresholds →
Statutory capital, clearing, margin & rate conventions.
Editorial Records
Authors & Review Records →
View named contributors where those records are available.
Complete Index
Master Research & Dossier Archive →
Browse all published briefings by topic pillar & date.